


Figure 3.
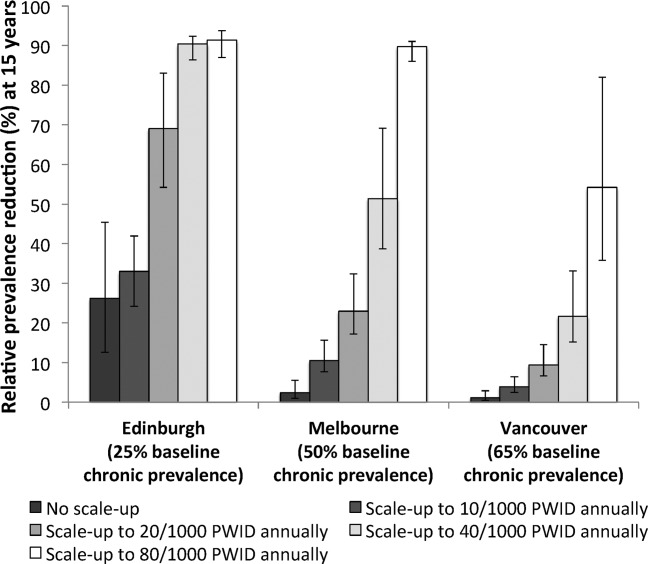
Relative prevalence reductions at 15 years (by 2027) with no treatment scale-up (8 per 1,000 PWID annually in Edinburgh, 3 per 1,000 PWID annually in Melbourne, and 5 per 1,000 PWID annually in Vancouver) and four treatment rate scenarios (10, 20, 40, and 80 per 1,000 PWID annually). Bars indicate the mean relative prevalence reductions, with whiskers representing the 95% CrI for the simulations.