


Figure 7. Quantitative analysis of the effect of FabB:FabA ratio on unsaturated fatty acid production.
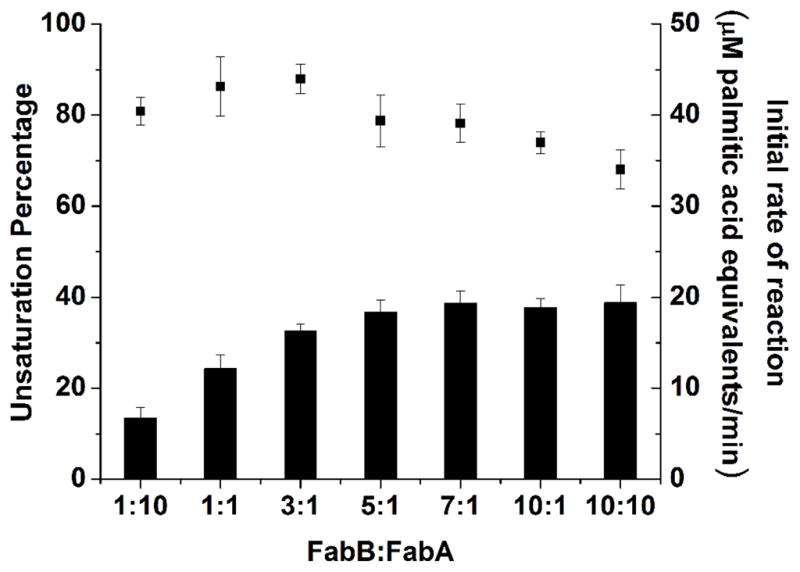
The bars correspond to the relative abundance of unsaturated fatty acid in the product mixture (left y-axis), and the black squares represent the initial turnover rate of the overall pathway (right y-axis). All data are means ± s.d. (n=3). For experimental details, see text.