


Fig. 3.
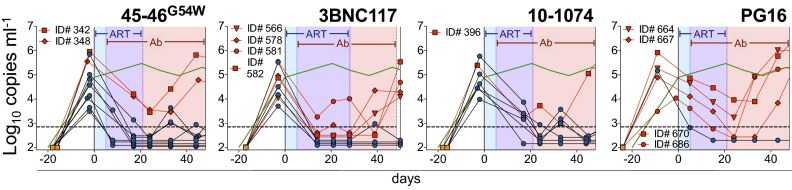
Combination of ART and single antibodies. Viral load measurements (symbols) from mice treated with ART and one of four monoclonal bNAbs are shown. Each line reflects a single mouse. Treatment was initiated at day 0 for all groups. Mice were treated for 5 d with ART alone and then with the combination of ART and the indicated antibody for 3 wk (45-46G54W, 10-1074, or PG16) or 4 wk (3BNC117). ART was then discontinued and bNAb monotherapy continued for an additional 3 wk (3BNC117) or 4 wk (45-46G54W, 10-1074, and PG16). Shading as in Fig. 2A; blue symbols/black lines, mice that remain controlled during immunotherapy after ART termination; red symbols/lines, mice that escape bNAb therapy; green line, as in Fig. 1A.