


Fig 2.
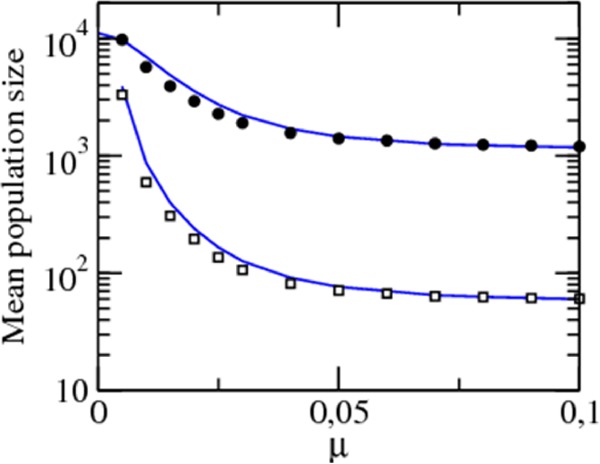
Average number of hosts (□) and viruses (●) in the population at different values of μ. The incorporation probability is fixed at a = 0.05. The blue curves correspond to the analytical estimates based on the average degree of immunity in each simulation.