


Fig. 2.
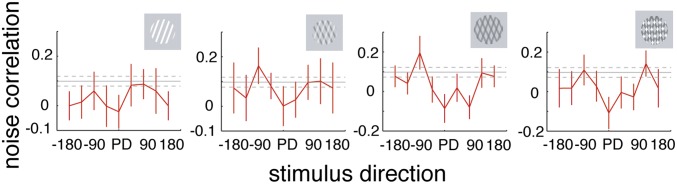
Noise correlation tuning for different stimulus types. Averaged noise correlations for different stimulus directions (relative to preferred). Neuronal pairs had similar PDs. Error bars represent SEM. Solid horizontal gray line represents mean value before stimulus onset (baseline), dashed lines the corresponding SEM. Stimuli yielding the different noise correlations are shown on the right.