


Fig. 3.
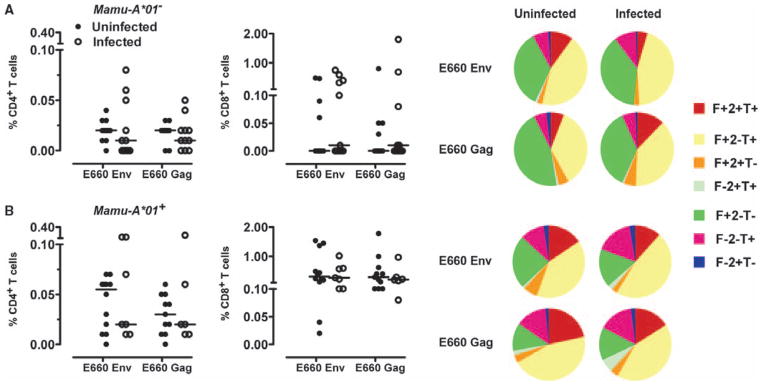
Vaccine-induced virus-specific cellular immune responses. (A and B) PBMCs isolated from Mamu-A*01–negative (A) and Mamu-A*01–positive (B) monkeys after the boost immunization were exposed to pools of overlapping peptides spanning the Gag or Env proteins of SIVsmE660, and the fractions of CD4+ or CD8+ T cells producing IFN-γ (F), TNF-α (T), or IL-2 (2) were determined by intracellular cytokine staining. Data are presented as the frequency of cytokine-producing CD4+ or CD8+ T cells from the groups of monkeys. The cytokine profiles of these cells were determined by expressing each cytokine response as a proportion of the total antigen-specific cytokine-producing CD4+ and CD8+ T cell response. Data were analyzed with the SPICE software and are presented in pie charts as the mean values from the experimental groups of monkeys. No statistically significant differences between the magnitudes of the responses in these groups in each study were noted as determined by the Mann-Whitney test.