


Figure 5.
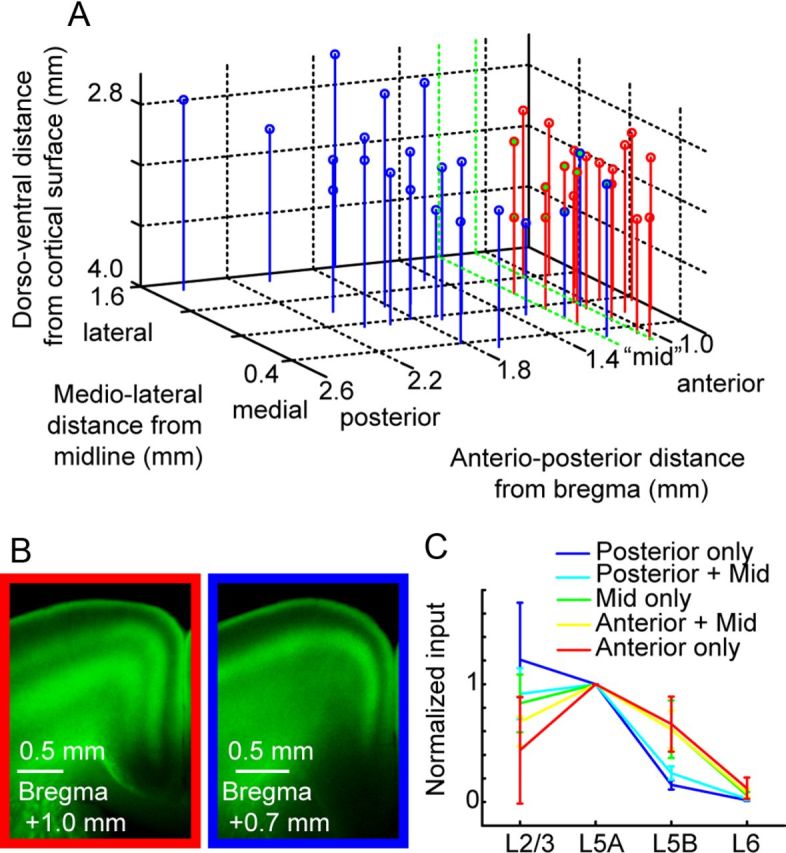
Analysis of motor cortex input from thalamus, grouped by injection site location. A, Thalamic injection coordinates were estimated based on sections containing strong AAV expression and dye coinjection with virus. Coordinates (in mm) are given in depth from the surface of cortex, distance from the midline, and anterior/posterior position relative to bregma (Paxinos and Franklin, 2004). Motor thalamus (red) and sensory thalamus (blue) overlapped in a region (∼1–1.2 mm posterior to bregma), designated as “mid” (green). B, Example images of axon pattern in cortex from anterior (left) and posterior (right) injections. This pattern was used to categorize injections into sensory and motor thalamic categories. C, Geometric means of the intensity ratio, normalized to the layer receiving the strongest input (L5A). The overlaid graph shows the mean ratio and SD (bootstrap, see Materials and Methods). In posterior injections (blue), L5B input was low, but L5B input strength increased in data groupings including mid (green) and anterior injection sites (red).