


Figure 1.
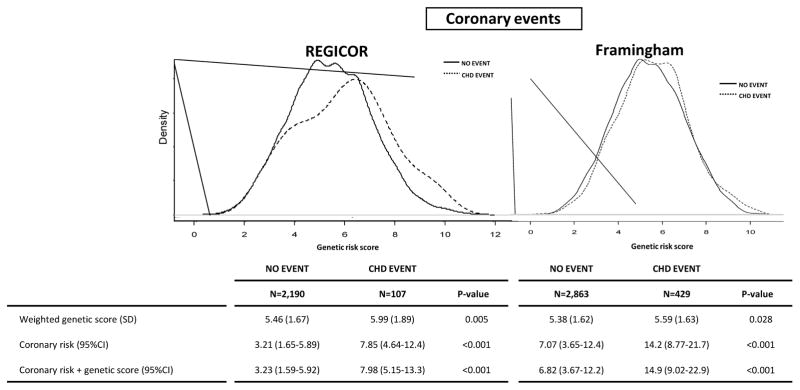
Distribution of genetic risk score in REGICOR and Framingham participants according to the incidence of coronary events during the follow-up. The genetic risk score is represented in the ordinal axis (X axis) and is computed as a cumulative sum of all the risk alleles that a person carries, weighted by the effect of each SNP, and theoretically ranging from 0 to 16 copies.
“No event”: all individuals except those who presented any cardiovascular event (CHD, stroke or peripheral arterial disease)