


Figure 1.
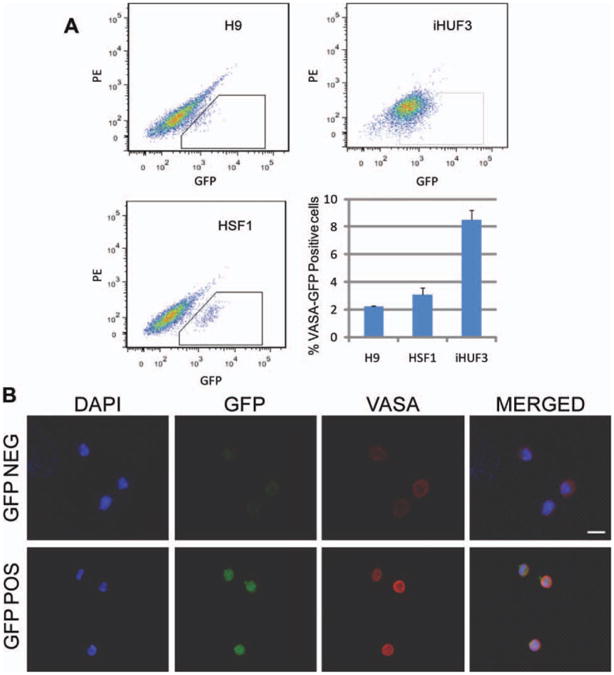
Fluorescence-activated cell sorting (FACS) of VASA-GFP positive and negative populations. (A): FACS plots and representation of the percentage of VASA-GFP positive cells we found for each cell line. Data are represented as mean ± SEM. (B): Representative VASA immunostaining of GFP-positive and -negative sorted populations. The scale bar represents a distance of 10 μm. Abbreviations: DAPI, 4′,6-diamidino-2-phenylindole; GFP, green fluorescent protein; PE, phycoerythrin.