


Fig. 7.
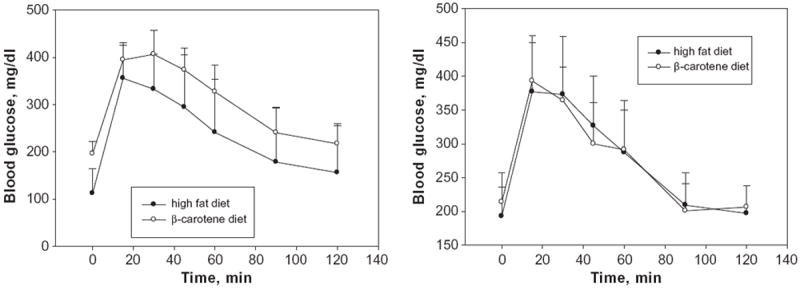
Glucose tolerance curves for wild type (left panel) and Bcmo1-deficient (right panel) mice fed either the high fat or the β-carotene diet. Values at each time are given as the mean ± 1 S.D. for 5 mice in each group. The calculated areas under the curve are not statistically different for either the wild type (right) or Bcmo1-deficient mice (left).