


Fig 11.
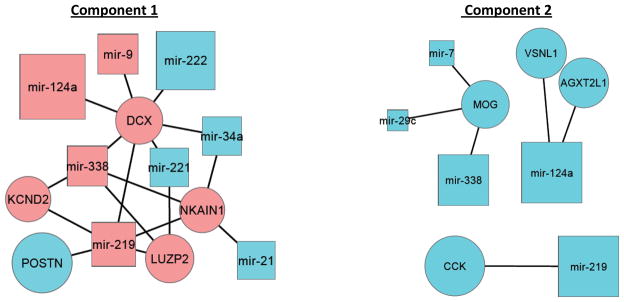
Network of predicted gene-miRNA interactions for the first two sparse joint components. Gene-miRNA pairs are linked if the miRNA is predicted to target the gene in two or more of the four databases miRanda, Pictar, RNA22 and TargetScan. Genes are shown as circles, and miRNAs are shown as squares. All predicted targets are shown between the 10 miRNAs with the largest absolute loading and the 10 genes with the largest absolute loading, for both components (genes and miRNAs with no targets are not shown). Genes and miRNAs with a positive loading are colored red, and with a negative loading are colored blue. The icon size is proportional to the absolute loading.