


Fig. 2.
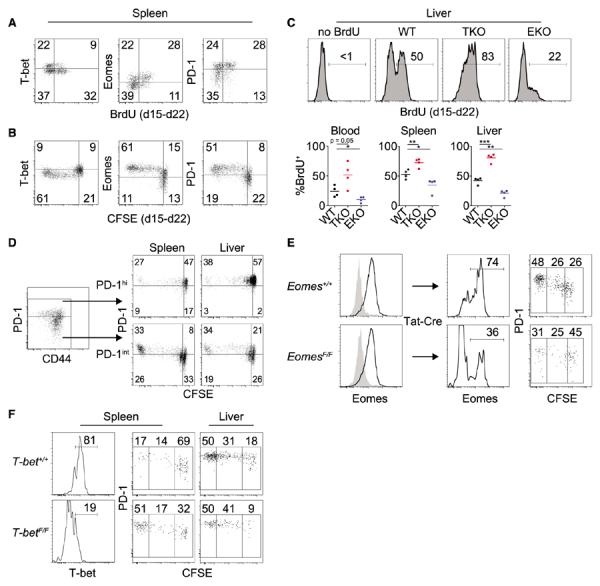
Conversion from T-bethi precursors to Eomeshi progeny is critical for the antiviral CD8+ T cell response. (A) Flow cytometric analysis of T-bet, Eomes, and PD-1 expression versus BrdU incorporation in Dbgp33-specific CD8+ T cells monitored from d15 to d22 p.i. Gates are placed between T-bethi and Eomeshi populations (fig. S4B). (B) Flow cytometric analysis of T-bet, Eomes, and PD-1 expression versus CFSE in Dbgp276-specific donor CD8+ T cells monitored from d15 to d22 p.i. (C) Flow cytometric analysis of BrdU incorporation in Dbgp276-specific CD8+ T cells from WT, TKO, and EKO mice monitored from d15 to d22. Upper panels are representative stains; lower panels are summarized data (*P < 0.05, **P < 0.01, ***P < 0.001; unpaired t test). In (A) to (C), data are representative of two to five independent experiments with at least three mice per experimental group. Gates were set on the basis of staining controls for BrdU, CFSE, GFP, or T-bethi and Eomeshi subsets. (D) Flow cytometric analysis of PD-1 expression versus CFSE dilution of sorted PD-1int or PD-1hi Dbgp276-specific CD8+ T cells 7 days after transfer. (E) Eomes+/+ and EomesF/F CD8+ T cells were isolated at d15 p.i. and treated in vitro with Tat-Cre. Two weeks after transfer, Dbgp276-specific CD8+ T cells were assessed for Eomes and PD-1 expression and CFSE dilution by flow cytometry. (F) T-bet+/+ and T-betF/F CD8+ T cells were isolated at d15 p.i. and treated in vitro with Tat-Cre. Two weeks after transfer, Dbgp276-specific CD8+ T cells were assessed for T-bet and PD-1 expression and CFSE dilution by flow cytometry. Data in (D) to (F) are representative of two to four independent experiments.