


Fig. 6.
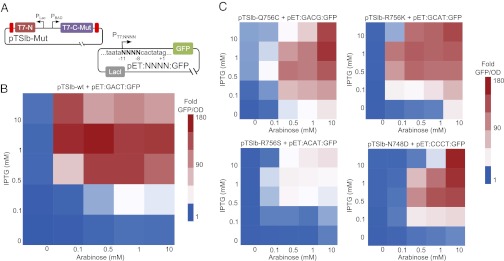
Testing transcriptional AND gates using the split T7 RNAP mutants. (A) To assess the two-input transfer function of split T7 RNAP, we cotransformed a plasmid containing the N-terminal and C-terminal fragment of split T7 RNAP downstream of PLac and PBAD, respectively, with another plasmid containing PT7 driving the expression of GFP. Here, Mut denotes a particular point mutation in the specificity loop and NNNN denotes the four nucleotides between −11 and −8 on PT7. (B) Heat map showing the relative fluorescence of the WT split T7 RNAP system described in A as a function of arabinose and IPTG. (C) Heat maps of the relative induction levels for different mutant T7 RNAP/promoter pairs (Upper Left, [Q756C,GACG]; Upper Right, [R756K,GCAT]; Lower Left, [R756S,ACAT]; and Lower Right, [N748D,CCCT]). Despite mutations to the specificity loop, each mutant split T7 RNAP preserved the two-input function observed in the wild-type case. For each heat map, values are recorded as fluorescence/OD for each value of inducer concentrations relative to the fluorescence/OD at 0 mM arabinose and 0 mM IPTG. The normalized fluorescence values used to create the extremes of the heat map in B and in C are plotted in Fig. S4.