


Fig 5.
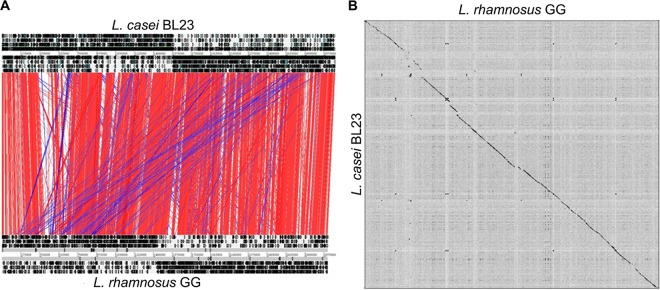
Genomic comparison of L. casei BL23 and L. rhamnosus GG. (A) ACT (Artemis Comparison Tool) comparison of L. rhamnosus GG (bottom chromosome) and L. casei BL23 (top chromosome) (55). Red and blue bars indicate similar regions between GG and BL23 (BLASTN hits), respectively, that have the same orientation or have been inverted. (B) Dot plot alignments of GG and BL23 using Gepard (56).