


Fig. 2.
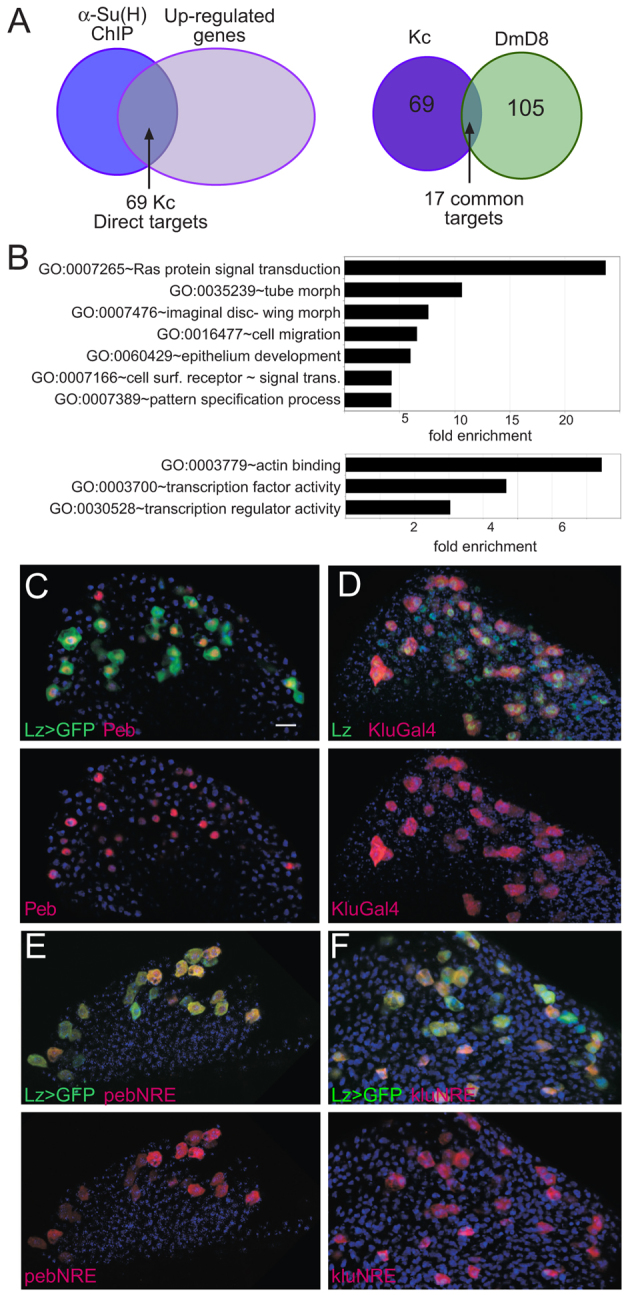
Identification of Notch targets in haemocytes. (A) Left: Venn diagram illustrating overlap between genes in proximity to Su(H)-bound regions [blue: anti-Su(H) ChIP, 185 bound regions] and upregulated after 30 minutes of Notch activation (mauve, 1302 upregulated transcripts) identifies 69 APGs that are putative direct Notch targets in Kc cells. Right: overlap between direct Notch targets identified in Kc cells (purple) and in DmD8 cells (green) is limited to 17 common genes. (B) Examples of over-represented GO (Biological Process, upper graph; Molecular Function, lower graph) categories in Kc direct Notch targets. (C-F) Expression of indicated targets and/or target enhancers in crystal cell lineage (marked by lz>GFP (C, E, F; green) and anti-Lz (D; green). See supplementary material Table S1 for a list of direct targets. Scale bar: 10 μm.