


Figure 4.
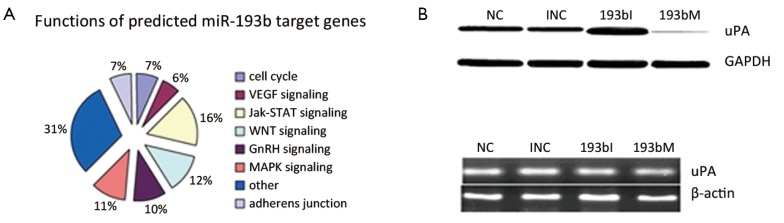
miR-193b down-regulated uPA protein in GC cells. A. Pie chart of predicted target genes involved in different pathways analyzed by Functional Annotation Bioinformatics Microarray Analysis Tools from CapitalBio Corporation; B. uPA protein expression levels were increased upon transfection with 193bI and decreased upon transfection with 193bM compared with control; C. uPA mRNA levels have no significant changes upon transfection with 193bI or 193bM compared with control. NC, negative control for BGC823-193b mimics; 193bM, BGC823-193b mimics; INC, negative control for BGC823-193b inhibitor; 193bI, BGC823-193b inhibitor