


Fig. 6.
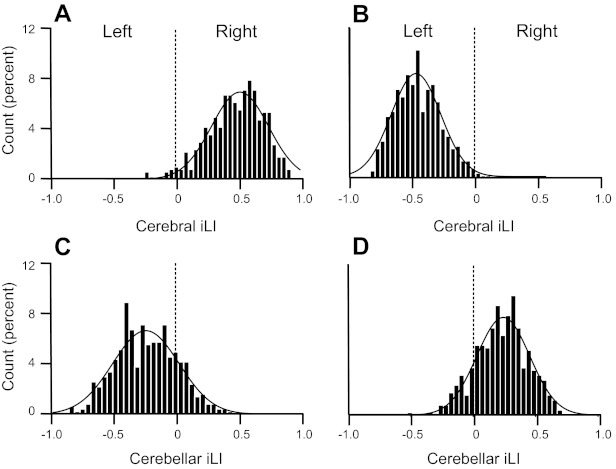
Quantitative estimates of asymmetry for individuals. Lateralized regions were defined in the discovery sample (n = 500) independently for the cerebrum and cerebellum. Laterality indices from each individual from the replication sample were then computed as the mean laterality index separately for the left- and right-lateralized regions. The resulting cerebral and cerebellar iLIs are shown in A–D for the replication sample of 500 subjects. iLIs were plotted for the lateralized regions identified by cerebral connectivity (A and B) and cerebellar connectivity (C and D). iLIs for right-lateralized cerebral/left-lateralized cerebellar regions (yellow regions in Fig. 3) are shown in A and C. iLIs for left-lateralized cerebral/right-lateralized cerebellar regions (blue regions in Fig. 3) are shown in B and D. A positive iLI value reflects right dominance. Curves represent the Gaussian fit. Note that the distributions were strongly lateralized but reversed for the cerebrum and cerebellum.