



Abstract
Brain glucose supplies most of the carbon required for acetyl-coenzyme A (acetyl-CoA) generation (an important step for myelin synthesis) and for neurotransmitter production via further metabolism of acetyl-CoA in the tricarboxylic acid (TCA) cycle. However, it is not known whether reduced brain glucose transporter type I (GLUT-1) activity, the hallmark of the GLUT-1 deficiency (G1D) syndrome, leads to acetyl-CoA, TCA or neurotransmitter depletion. This question is relevant because, in its most common form in man, G1D is associated with cerebral hypomyelination (manifested as microcephaly) and epilepsy, suggestive of acetyl-CoA depletion and neurotransmitter dysfunction, respectively. Yet, brain metabolism in G1D remains underexplored both theoretically and experimentally, partly because computational models of limited brain glucose transport are subordinate to metabolic assumptions and partly because current hemizygous G1D mouse models manifest a mild phenotype not easily amenable to investigation. In contrast, adult antisense G1D mice replicate the human phenotype of spontaneous epilepsy associated with robust thalamocortical electrical oscillations. Additionally, and in consonance with human metabolic imaging observations, thalamus and cerebral cortex display the lowest GLUT-1 expression and glucose uptake in the mutant mouse. This depletion of brain glucose is associated with diminished plasma fatty acids and elevated ketone body levels, and with decreased brain acetyl-CoA and fatty acid contents, consistent with brain ketone body consumption and with stimulation of brain beta-oxidation and/or diminished cerebral lipid synthesis. In contrast with other epilepsies, astrocyte glutamine synthetase expression, cerebral TCA cycle intermediates, amino acid and amine neurotransmitter contents are also intact in G1D. The data suggest that the TCA cycle is preserved in G1D because reduced glycolysis and acetyl-CoA formation can be balanced by enhanced ketone body utilization. These results are incompatible with global cerebral energy failure or with neurotransmitter depletion as responsible for epilepsy in G1D and point to an unknown mechanism by which glycolysis critically regulates cortical excitability.
Keywords: epilepsy, brain metabolism, TCA cycle, acetyl-coenzyme A, glutamate, glutamine, GABA, GLUT1, GLUT-1, glucose transporter, ketones, fatty acids, EEG
INTRODUCTION 1
Glucose is the major carbon and energy source of nerve cells, supporting brain growth and neural excitation (Schurr, 2002). GLUT-1, the glucose transporter of capillary endothelial cells located at the blood brain barrier (BBB), facilitates the passive flux of glucose from blood to brain (Wang et al., 2006). Within neural tissue, GLUT-1 is also responsible for astrocyte glucose transport. Thus, brain glucose flux into any brain region is determined, at least in part, by flux through an undetermined series of GLUT-1-containing cell membranes, together with glucose flux taking place in parallel via intercellular diffusion. In contrast, the transporter isoform GLUT-3 is predominantly expressed by neurons and facilitates the uptake of glucose from the brain’s intercellular milieu, such that GLUT-1 insufficiency can potentially impact the metabolism of both glia and neurons (Carruthers et al., 2009). In man, heterozygous mutation of GLUT-1 leads to chronic hypoglycorrachia (decreased cerebrospinal fluid glucose concentration) and neurological dysfunction, which constitute the defining features of the GLUT-1 deficiency syndrome (G1D) (De Vivo et al., 1991; Pascual et al., 2007; Pascual et al., 2004). Paradoxically, G1D is associated with hyperexcitability (excessive neuronal activation primarily manifested as spike-wave epilepsy and other paroxysmal movement disorders) rather than hypoexcitability (Leary et al., 2003; Pascual et al., 2008). The syndrome is most often refractory to anticonvulsants and is also associated with reduced myelin deposition and brain growth leading to microcephaly, in addition to intellectual impairment (Pascual et al., 2002).
Despite clinical observations suggestive of brain glucose uptake impairment in G1D (Pascual et al., 2002; Pascual et al., 2007), the mechanisms responsible for neural dysfunction, epilepsy and cerebral hypotrophy remain unexplored (Perez-Duenas et al., 2009). The impact of GLUT-1 deficiency on cerebral glucose flux and metabolism is also unknown: Aside from the well-established neurochemical contention that glucose transport is not rate-limiting for brain metabolism except under conditions that approach zero blood glucose (Auer, 2004), mathematical models of brain metabolism that contemplate reduced glucose transport under physiological blood glucose levels offer conflicting results: the predicted consequences of clinically-relevant GLUT-1 loss of function on brain metabolic rate may range from minimal to severe (Aubert et al., 2007; Barros et al., 2007; Barros et al., 2005; Jolivet et al., 2010; Mangia et al., 2011; Mangia et al., 2009; Pellerin et al., 2007; Pellerin and Magistretti, 2004b; Simpson et al., 2007). This may be due to model inaccuracies stemming from assumptions about the brain’s cellular composition and from the existence of additional mechanisms for metabolic substrate flux and utilization of unknown magnitude in in vivo pathological states. As a result, and despite the common contention that G1D represents a cerebral energy failure syndrome, it has been difficult to predict whether cerebral energy metabolism (in particular the Krebs cycle, as a crucial energy-metabolism mechanism supported by glucose under normal conditions) is indeed compromised in G1D.
Current mouse models of G1D have allowed modest progress with regards to investigating brain metabolism or energy failure in the disease, owing largely to either extreme phenotypic severity, including anencephaly or severe cerebral dysgenesis observed after profound GLUT-1 suppression (Heilig et al., 2003a; Heilig et al., 2003b) and, on the opposite end of the spectrum, to mild hyperexcitability brought about only when fasting and in association with a discreet reduction in mouse cerebral GLUT-1 abundance in the hemizygous state (Ohtsuki et al., 2006; Wang et al., 2006). Therefore, questions such as whether the characteristic generalized spike-wave seizures that accompany severe hyperexcitability in the most common (epileptic) form of G1D in man are associated with global or regional brain dysfunction and, more specifically, whether G1D impacts vulnerable or epileptogenic circuits, remained unaddressed.
We set out to answer the question of cerebral metabolism integrity and hyperexcitable circuit identification in G1D by characterizing the key metabolic and electrophysiological features of transgenic mice (antisense GLUT-1, generated by Heilig et al. (Heilig et al., 2004; Heilig et al., 2003b)) that manifest a clinically-relevant form of the disorder amenable to mechanistic investigation. G1D mice exhibited relevant features of human G1D, such as frequent spontaneous seizures, decreased brain glucose uptake and differentially decreased GLUT-1 expression across select brain regions, with little or no increase in GLUT-3 expression. In particular, thalamus and cortex displayed the lowest GLUT-1 expression and regional glucose uptake. In multielectrode array recordings, brain slices that retained both cerebral cortex and thalamus spontaneously displayed persistent 3 Hz electrical oscillations. Despite the presence of reactive astrocytosis in the brain of G1D mice (Ullner et al., 2009) and in contrast with other rodent models of pharmacologically-induced epilepsy (Ortinski et al., 2010), glutamine synthetase expression was preserved in G1D. This finding does not support the thesis of abolished neuron-glia neurotransmitter cycling, particularly in light of further results: Brain amino acids such as glutamate, glutamine, GABA and aspartate, in addition to TCA cycle intermediates and biogenic amine neurotransmitter contents, were preserved in G1D. In contrast, acetyl-CoA and fatty acids were diminished in G1D mice. Plasma fatty acids were elevated, as were ketone bodies. The results thus suggest that, in G1D, 1) brain sources of acetyl-CoA are primarily utilized to preserve global (i.e., whole-brain) TCA cycle contents and neurotransmitters, probably maintaining aerobic metabolism while impacting the synthesis of fatty acids and myelin, and 2) epilepsy is associated with thalamocortical hypersynchronization and with disproportionately reduced cortical and thalamic glucose influx. The mouse model will therefore allow the testing of further hypotheses including, among others, those related to anaerobic glycolysis impairment in G1D, metabolic treatment efficacy and potential thalamocortical hyperexcitability mechanisms as targets for additional therapeutic intervention.
MATERIALS AND METHODS
All studies described conformed with the Institutional Animal Care and Use Committee guidelines of UT Southwestern Medical Center. 52 mutant and an equal number of littermate normal (control) mice were used and all were between 3 and 5 months of age except as noted. Approximately equal numbers of male and female mice were studied except where otherwise specified.
Animal model
The antisense GLUT-1 mouse model will be separately described in detail by Heilig et al. (manuscript in preparation and (Heilig et al., 2004)) In brief, G1D transgenic antisense mice were identified with a specific 32P-labeled SV40 DNA probe by Southern blot analysis using standard methods (Heilig et al., 2003b). Mice were crossed back repeatedly (>20 generations) into C57BL/6 background to yield inbreeding. The pattern of inheritance was, as expected, autosomal dominant with full penetrance of the phenotype.
Western blot
Following decapitation of conscious animals (4 normal and 4 G1D), forebrain (i.e., the entire cerebrum rostral to the superior cerebral peduncles, cortex, thalamus and striatum from each animal were manually dissected under a magnifying lens either in toto or with the aid of a 3 mm tissue punch, quickly immersed in liquid nitrogen and kept at −80°C. Brain protein was extracted via tissue immersion in homogenization buffer (50mM NaF, 5mM EDTA, Dulbecco’s Phosphate-buffered saline, pH7.2) with an inhibitory cocktail protease (Calbiochem, San Diego. CA), 1mM PMSF (Sigma, St. Louis, MO) and PIM (Sigma) and homogenized under ice with an ultrasonic processer (Cole-Parmer, Vernon Hills, IL). Following sonication, Igepal was added to a final concentration of 1% to 10% (v/v), and samples were incubated and inverted at 4°C for 1 hour. Extracts were then centrifuged at 5000 rpm for 5 min at 4°C and the supernatant transferred to a fresh tube and stored at −80°C. Protein concentration was determined by BCA assay. Western blots were performed using 10μg of total protein. Protein samples were resolved by sodium dodecyl sulfate-polyacrylamide gel electrophoresis (SDS-PAGE) using 10% acrylamide gels. Proteins were transferred to Hybond-ECL membranes (GE Healthcare, Piscataway, NJ) blocked with 5% dry nonfat milk dissolved in PBS-T (PBS containing 0.1% tween-20) for 1 h. The nitrocellulose membranes were incubated with a polyclonal rabbit anti-GLUT-1 antibody (Rabbit Anti-Mouse Glut-1(GT11-S), Alpha Diagnostic, San Antonio, TX), diluted 1:5000 in blocking solution overnight at 4°C under gentle shaking. The membranes were washed with PBS-T and incubated with a secondary anti-rabbit IgG antibody (Goat Anti-Rabbit IgG(H+L), Pierce, Rockford, IL), diluted at 1:10000 and coupled to horseradish peroxidase for 1h at room temperature. Protein detection was performed via an ECL plus system (GE Healthcare). Glyceraldehyde-3-phosphate dehydrogenase (GAPDH) was used as a protein quantification control and detected with a monoclonal antibody (AM4300, Applied Biosystems, Carlsbad, CA) at 1:800,000 dilution after overnight incubation at 4°C. Optical density analysis of GLUT-1 and GAPDH was performed using QuantityOne software (Bio-Rad, Hercules, CA). Similar procedures were followed for GLUT-3 western blot analysis.
Autoradiography
3 normal and 3 G1D mice were studied. 14C-2-deoxyglucose was administered intraperitoneally (0.4μCi/g) to conscious female mice. Following injection, the mice were allowed to rest freely for 45 min. Animals were then intracardially perfused with 0.9 % saline (rate: 2.5cc/min, total infusate ~ 15cc) under anesthesia (ketamine (100mg/kg), xylazine (10mg/kg)) to remove brain blood before brain extraction. The brains were then placed into a glass beaker containing cold isopentane and placed inside a cryostat. The brains were then transferred to cooled casting cylinders and embedded for sagittal sectioning in Tissue Freezing Medium (TFM, Triangle BioScience, Durham, NC). Prior to sectioning, tissue blocks were stored at −85 °C. Sagittal sections were cut at 20 μm intervals covering the region of the cerebellar peduncle, affixed to positively charged slides and air dried for 30 minutes. Sections were then fixed and TFM removed by serial dip in 70% ethanol followed by air drying. The slides were coated in K.5 nuclear emulsion (Ilford, Avon CT), and exposed at 4 °C for 21 days. The autoradiographic signal was detected using a D-19 developer and Kodak Fixer (Eastman-Kodak, Rochester, NY). Silver particle count was performed using Image J (Rasband, W.S., National Institutes of Health, Bethesda, MD; http://rsb.info.nih.gov/ij/). Silver grain counts per area were determined under 10× magnification using images from cortex, thalamus and striatum from each animal. Several microscopic fields were merged to fully cover individual brain structures in each section analyzed. Ratios of average brain structure counts in G1D relative to normal mice were calculated.
Electroencephalography (EEG)
4 normal and 4 G1D mice were anesthesized with a 1 ml intraperitoneal injection of ketamine (25 mg/ml), xylazine (2.5 mg/ml) and stereotaxically implanted with four epidural gold-plated electrodes (from bregma, 1.1 ± 1.45 mm and −3.5 ± 1.45 mm) attached to a custom connector and secured with dental cement as previously described (Sinton et al., 2009). Animals were then allowed to recover for a minimum of 7 days prior to EEG recordings, for which they were connected to a commutator system allowing free movement and access to food and water. 24-hour EEG recordings were performed in both GLUT1 (n=4) and control mice (n=4) on a Grass Model 78 (Grass Technologies, West Warwick, RI) in an ipsilateral bipolar mode over the frequency range 1–30 Hz, digitized at 250 Hz and saved to computer for offline analysis. EEG recordings were visually inspected for the presence of epileptiform activity by a user blinded to the mouse category. EEG spectral data were graphically presented using a custom-made MatLab (The MathWorks, Inc. Natick, MA) program.
Multielectrode array recordings
In order to record the pattern of electrical activity from cortical neuronal ensembles with preserved thalamocortical connections, a 64-channel passive planar array (Panasonic USA, Secaucus, NJ) was used. 3 normal and 3 G1D mice were used. 350 μm-thick thalamocortical slices were generated by sectioning brains harvested after decapitation at 55° on a vibratome (Leica VT 1200S, Leica Microsystems Inc., Buffalo Grove, IL). Multielectrode array (MEA) field potential recordings were obtained from the sensory (barrel) cerebral cortex of both G1D (n=3) and normal (n=3) P28–P35 mice using thalamocortical brain slices. The barrel cortex preparation is a metabolically-active, widely used model for studies of brain energy metabolism and excitability. Acutely-used (less than 8 hours) slices were superfused with 95% O2 and 5% CO2-bubbled artificial cerebrospinal fluid (aCSF) solution containing 2.5 mM glucose at 32°C. These slices were not exposed to stimulation or neurotransmitter receptor or ion channel blockers.
Amino acid contents
Five animals in each control and G1D group were decapitated without anesthesia. Cortex, thalamus and striatum perchloric acid extracts were collected and amino acids were separated by ion exchange high-pressure liquid chromatography (HPLC) with post-column derivatization using ninhydrin and detected by ultraviolet visible spectral analysis at 570 nm as previously described (Ersser and Davey, 1991).
Biogenic amine contents
Brain neurotransmitter monoamines such as dopamine (DA) and serotonin (5-HT) and their metabolites 3,4-dihydroxyphenylacetic acid (DOPAC), homovanillic acid (HVA), 3-methoxytyramine (3-MT) and 5-Hydroxyindoleacetic acid (5-HIAA) were determined from the same five animals used for amino acid analysis by HPLC with colorimetric electrochemical detection. Frozen cortex, thalamus and striatum were homogenized in 5 volumes (v/v) of perchloric acid (0.1M). 10 μL of clear supernatant obtained after centrifugation was directly injected onto a HPLC column (C18 250 × 3 mm, 5μl, Phenomenex, Torrance, CA) and separated by isocratic elution at a flow rate of 0.5 ml/min with a mobile phase consisting of potassium phosphate (0.05 mM), octylsulfate (8.5 mg/50ml) and 14% methanol, adjusted to pH 2.65. Monoamines were then detected using an electrochemical cell (model 5014B, ESA Inc, Chelmsford, MA) set to a potential of +400 mV.
Cerebral lipid contents
Forebrain lipids were extracted from G1D and control mice not subject to fasting (6 mice were studied for each group) via the Folch extraction procedure (Folch et al., 1957). The lower phase was diluted to a final volume of 5 ml. Aliquots were collected and dried for enzymatic measurement of cholesterol, cholesterol esters (ab65359 kit, Abcam, Cambridge, MA), free fatty acids (Wako NEFA-HR(2) Microtiter Procedure, Wako Diagnostics, Richmond, VA) and triglyceride concentrations (TRI19-1KT kit, Sigma, St Louis, MO). For the measurement of triglyceride concentrations, the aliquots were suspended in 30μl of tertbutanol and 30μl of Triton X-100/methanol (1:1 v/v) in order to increase solubility.
Blood and plasma metabolite assays
All animals used for brain lipid determination were also utilized for blood and plasma metabolite assays. Blood glucose levels were determined with a Contour® glucometer before decapitation (Bayer Healthcare, Tarrytown, NY). Total plasma ketone concentration and plasma β-hydroxybutyrate (BHB) levels were determined using a commercial kit (Wako Chemicals, Richmond, VA). Plasma free fatty acids were measured using an NEFA-HR (2) kit (Wako Chemicals).
Brain acyl-CoA and other TCA cycle intermediates
A set of G1D (n=7) and normal (n=5) forebrains was collected after conscious decapitation and flash-freezing on dry ice (brain dissection time <15 s) according to standard procedures validated at the Metabolic Mouse Phenotyping Center at Case Western University (MMPC) the and shipped to the MMPC for chromatography mass spectrometry (GC-MS/LC-MS) and characterization of acetyl-CoA, TCA cycle intermediates and derivatives as previously described (Kombu et al., 2011; Zhang et al., 2009; Willis et al., 2010).
Confocal microscopy
4 normal and 5 G1D mice per each of two age groups (P28 and P128) were anesthetized with ketamine/xylazine mixture as described above before cardiac perfusion and perfused with 20 ml of PBS followed by 20ml of 4% paraformaldehyde (PFA) in PBS (v/v). The brain were dissected and post-fixed overnight at 4°C in 4% PFA. Whole brains were encased in blocks of 3% agarose and sectioned into 40μm coronal sections on a vibratome (Leica VT 1200S, Leica Microsystems Inc., Buffalo Grove, IL). Every sixth section was used for immunostaining. Sections were first washed three times in 0.3% TritonX in PBS and then blocked with 10% normal goat serum in 0.3% TritonX in PBS for 2h. Sections were incubated overnight at 4°C with primary antibodies: mouse anti-glutamine synthetase (1:1000 Anti-Glutamine Synthetase (MAB302), Millipore, Billerica, MA), and rabbit anti-glial fibrillary acidic protein (1:1000 1:1000. Polyclonal Rabbit Anti-Glial Fibrillary Acid Protein(Z 0334), DaKo, Carpinteria, CA). Sections were washed again with 0.3% TritonX PBS three times and incubated in secondary antibodies: DyLight 594-goat anti-mouse and DyLight 488- goat anti-rabbit (1:500; Jackson ImmunoResearch, West Grove, PA) for 2h at room temperature. Sections were then washed twice with 0.3% triton PBS and twice with PBS. Tissue sections were placed onto glass slides, mounted with Immu-mount (Thermo Scientific, Kalamazoo, MI) and secured with cover slips. Images were obtained using a confocal microscope (Leica TCS SP5, Leica).
Statistical analyses
Except where indicated, two-sample t-tests were performed not assuming equal variances and with Wilcoxon Rank test using SPSS Graduate Pack version 18.0 (SPSS; Chicago, IL). All Figures with bar plots represent SEM in brackets.
RESULTS
G1D mouse appearance
Antisense transgenic animals were well groomed but displayed severe ataxia (not shown). G1D mice also manifested generalized jerks at rest and upon walking and an exaggerated response to tactile and acoustic stimuli (hyperekplexia). Due to prohibitive motor limitations, transgenic animals were not trained for Rotarod or beam walking tests. Body weight of adult transgenic mice was 17.94 ± 0.24 g (n=8); significantly smaller (P < 0.001) than that of normal littermate mice (26.58 ± 0.93 g; n=5). In addition, brain weight of G1D mice was significantly (P < 0.01) smaller than that of normal animals (G1D: 283.6 ± 3.5 mg; n=8; normal: 308.4 ± 6.6 mg; n=5).
Brain GLUT-1 is significantly reduced in G1D
The expression of the GLUT-1 protein in forebrain, cortex, thalamus and striatum was determined in adult control and transgenic mice by western blotting and normalized to glyceraldehyde-3-phosphate dehydrogenase (GAPDH) (Figure 1A). In G1D forebrain, GLUT-1 protein was approximately 50% of normal animals. In cortex and thalamus, the expression of GLUT-1 was also reduced in transgenic mice by approximately 31% and 51% relative to control, respectively. Conversely, the amount of GLUT-1 protein in the striatum was similar in both groups of animals. These results are quantified in Figure 1B. GLUT-3 abundance was less significantly affected in G1D: For whole brain, GLUT-3 expression relative to GAPDH was 1.42 ± 0.10 in G1D, compared with 1.357 ± 0.1106 in normal mice (no significant difference was found between both groups). In cortex and thalamus, similar results were found: The GLUT-3/GAPDH ratios were 1.14 ± 0.16 (G1D) and 0.91 ± 0.01 (normal mice), and 0.87 ± 0.10 (G1D) and 0.77 ± 0.04 (normal mice), respectively. However, in striatum the ratios were significantly different (p<0.01): 0.95 ± 0.05 (G1D) and 0.71 ± 0.05 (normal mice) (n= 4 for each group), highlighting a relative preservation or increase for both glucose transporters in the striatum.
FIGURE 1. Brain GLUT-1 expression.
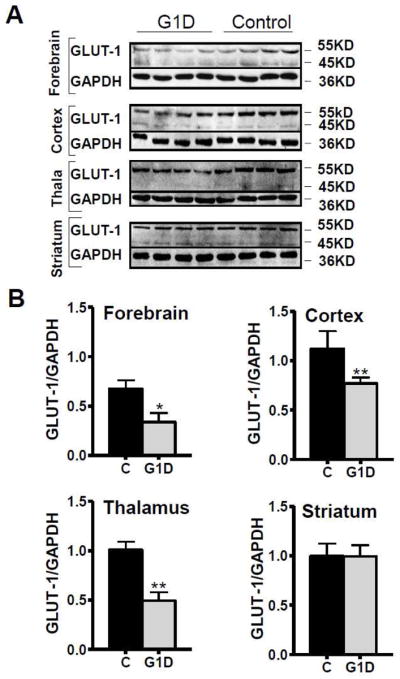
(A) GLUT-1 expression was determined by western blot in forebrain, cortex, thalamus and striatum of adult transgenic (n=4) and control mice (n=4). The two GLUT-1 isoforms (55 kDa GLUT-1 in endothelial cells and 45 kDa GLUT-1 in astrocytes) and glyceraldehyde-3-phosphate dehydrogenase (GAPDH) are illustrated. (B) GLUT-1 and GAPDH signals were quantified using an optical densitometer. The densities of GLUT-1 signal were normalized to GAPDH signal. The averaged GLUT-1/GAPDH ratios for forebrain, cortex, thalamus and striatum are illustrated (mean ± SEM). In forebrain, cortex and thalamus, the relative GLUT-1 expression is significantly reduced in G1D mice relative to controls. In the striatum, however, there were no statistical differences in GLUT-1 expression between the animal groups. * P <0.05, ** P<0.01.
Brain deoxyglucose accumulation is impaired in G1D mice
Cerebral deoxyglucose deposition (influenced by uptake among other factors) was evaluated in transgenic and control mice by 14C-2-deoxyglucose (2DG) autoradiography. In order to achieve precise regional quantification, deoxyglucose distribution was evaluated in cortex, thalamus and striatum after tracer injection in the conscious state. Figure 2 illustrates the ratio of deoxyglucose accumulation between G1D animals and controls. In agreement with FDG-PET results, deoxyglucose accumulation was significantly lower in G1D cortex (ratio: 0.67 ± 0.15) and thalamus (ratio: 0.66 ± 0.08) relative to control. However, accumulation in the striatum was only modestly decreased in G1D (ratio: 0.87 ± 0.02), which is consistent with the relatively preserved expression of GLUT-1 (and perhaps the slight increase in GLUT-3) protein in this region observed by western blot.
FIGURE 2. Brain 14C-deoxyglucose accumulation determined by autoradiography.

The upper panel shows a schematic representation of 14C-2-deoxyglucose distribution in normal brain by autoradiography. The averaged ratio (with SEM in brackets) of deoxyglucose accumulation in cortex (marked as 1 in the upper panel), striatum (2 in the upper panel) and thalamus (3 in the upper panel) between G1D and control animals is illustrated in the lower panel. All accumulation values were significantly lower in G1D brain regions relative to normal mice. In agreement with FDG-PET data, deoxyglucose distribution was notably lower in the cortex and thalamus of the G1D compared to the control animal. However, accumulation in the striatum was slightly lower in G1D, which is consistent with the similar expression of GLUT-1 in this brain region across both animal groups.
G1D mice manifest seizures
EEG recordings from both control and G1D mice were studied over a 24 hour period which included both awake and sleep states. Control mice displayed normal EEG activity during sleep and wakefulness; however G1D mice had very frequent epileptic spikes and series of spike and spike-wave activity (Figure 3) both while awake and during sleep, with no apparent difference during vigil states relative to sleep. Repetitive epileptiform spike and spike wave activity generally persisted for 3–10 seconds and was associated with an increase of power in the theta frequency band (5–8 Hz) at each event (Figure 3). No consistent behavioral changes were apparent during the epileptiform activity, although some electrographic events were associated with a generalized pause of all discernible activity typical of an absence-type seizure. In addition, myoclonic jerks were apparent during some short periods of epileptiform activity or associated with a large spike on the EEG. Seizure events occurred in all G1D mice and at a frequency of 4–8 events per hour. In addition, G1D animals were fasted for the last 4 hours of the recording (awake state); however, no apparent change in recorded spikes or continuous epileptiform activity occurred during this time.
FIGURE 3. Representative EEG activity recorded from awake G1D mice.

The top EEG Trace shows a typical epileptic spike seen in all G1D mice. The bottom EEG Trace shows a series of spike and spike-wave discharges associated with epileptiform activity within the left frontal cortex. The spectral power of the EEG signal is represented by the bottom plot which shows an increase of spectral power in the theta frequency band (4–8 Hz) during the indicated spike-wave discharge shown above (bracketed arrow to white ellipse) and also in three subsequent events (white ellipses) which occurred during this representative one hour window of EEG recording. Left Axis: normalized power with representative graybar intensity, Bottom Axis: time in minutes, Right Axis: frequency in Hz.
G1D displays thalamocortical oscillations
Multi-electrode array (MEA) field potential recordings were obtained from the somatosensory barrel cerebral cortex (Figure 4) of both G1D (n=3) and normal (n=3) P28–P35 mice using thalamocortical brain slices unexposed to pharmacological agents. MEA recordings obtained in 2.5 mM glucose showed a robust, spontaneous 3 Hz oscillatory activity in the G1D cortex detectable from all the electrodes, indicating hypersynchronization between the thalamus and cortex, absent from G1D slices that excluded the thalamus (n=10) (data not shown).
FIGURE 4. Thalamocortical oscillations in G1D brain slice.
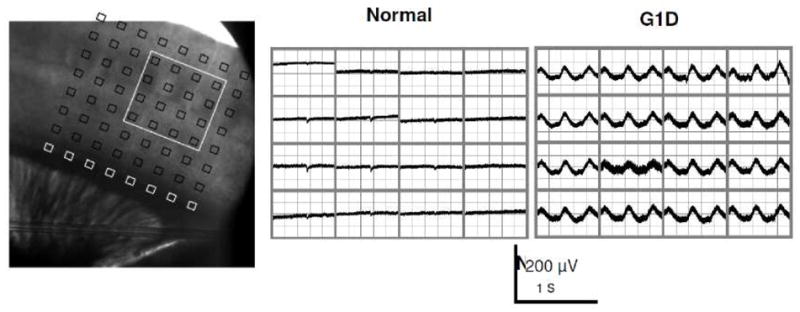
Left panel: Thalamocortical slice preparation with 64-channel multi electrode array (MEA) positioned over the sensory barrel cortex. Center panel: Normal mouse: Field potential recording from MEA array positioned as in left panel showing the 16 electrode positions as designated by the white box outlined in left panel. Right panel: G1D mouse: note the ~3 Hz oscillation in all the electrodes indicative of thalamocortical hypersynchronization. Slices were bathed in drug-free, 2.5 mM glucose-containing perfusate.
Reactive astrocytosis and preserved glutamine synthetase expression in G1D
There is growing evidence that several disorders of the nervous system including epilepsy, are associated with the reactive astrocytosis (Ortinski et al., 2010; Seifert et al., 2006). Cortical reactive astrocytosis has also been identified in our previously reported milder model of G1D, especially in adult mice (Ullner et al., 2009). In epilepsy, reactive astrocytes manifest phenotypic changes such as a reduction in glutamine synthetase (GS) expression (Eid et al., 2004; Ortinski et al., 2010), an enzyme critical for glutamine production and to maintain the glutamate-glutamine cycle between neurons and glia (Pellerin and Magistretti, 2004a). Recognition of the importance of GS in neurotransmitter cycling has led to the hypothesis that deficits in the glutamate-glutamine cycle due to GS dysfunction may contribute to the development of epilepsy (Chaim-Matyas et al., 1993; Eid et al., 2008). To evaluate the expression of GS in reactive astrocytes typical of G1D, we carried out immunohistochemical studies of GFAP and GS at P28 and P120. Consistent with previous observations, we detected reactive astrocytosis, which was more manifest in the adult stage (P120), as indicated by enhanced GFAP reactivity (Figure 5B), in the context of preserved expression of GS at both P28 and P120 (Figure 5A and 5B). Thus, in contrast with other epileptic conditions, these results indicate that GS expression is not suppressed in the reactive astrocytes found in the cortex of G1D mice. Identical results were obtained for the striatum and thalamus (not shown).
FIGURE 5. Astrocytic proliferation with preservation of glutamine synthase (GS) in G1D.
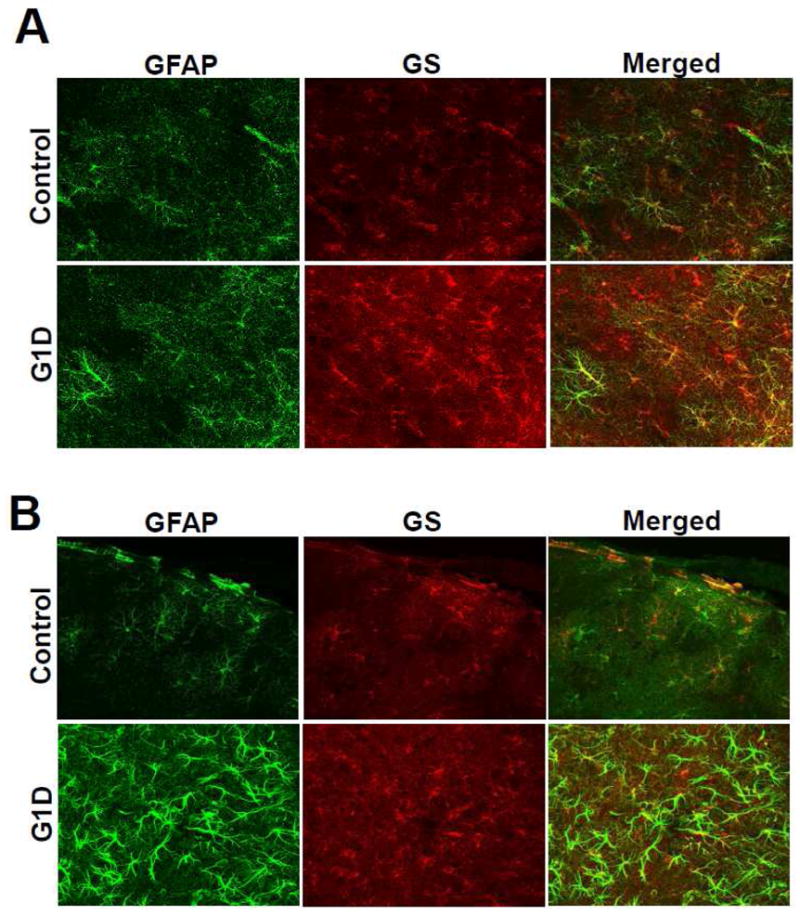
Z-stacked, 10×, 40 μm confocal images of the barrel cerebral cortex (4 normal and 5 G1D entire brains were studied at 240 μm coronal section intervals) at P28 (A) and P120 (B) after reaction with antibodies anti-glial fibrillary acidic protein (GFAP) and anti-GS. G1D is associated with astrocytic proliferation, which is more prominent in adult animal but, importantly, not with GS depletion.
Brain acetyl-CoA levels are decreased whereas TCA cycle intermediates and derivatives are preserved in G1D brain
To determine whether impaired glucose entry into the brain of G1D mice limits the synthesis of key metabolic intermediates, the abundance of acetyl-CoA, TCA cycle intermediates and their derivatives such as glutamine, aspartate, alanine and neurotransmitters glutamate and GABA was determined. Acetyl-CoA levels were significantly lower in G1D animals, whereas TCA cycle intermediates and their derivatives were not significantly different in both animal groups (Table 1 and Table 2). This suggests that alternative fuels may potentially replenish the TCA cycle to maintain intermediate abundance and/or that acetyl-CoA metabolism may be compartmentalized, such that, under conditions of reduced acetyl-CoA concentration, a significant fraction is destined to fuel the TCA cycle to preserve flux, and this may occur at the expense of other metabolic pathways.
TABLE 1.
Brain acetyl-CoA, TCA cycle intermediates and derivatives.
| Brain metabolites | Control | G1D |
|---|---|---|
| Ac-CoA (nmol/g) | 2.11 ± 0.25 | 1.66 ± 0.13* |
| TCA cycle intermediates (μmol/g) | Control | G1D |
| Citrate | 0.92 ± 0.01 | 0.92 ± 0.02 |
| Succinate | 0.28 ± 0.01 | 0.27 ± 0.01 |
| Fumarate | 0.34 ± 0.03 | 0.35 ± 0.03 |
| Malate | 0.40 ± 0.01 | 0.40 ± 0.02 |
| TCA cycle products (μmol/g) | Control | G1D |
| Glutamate | 13.40 ± 0.18 | 13.50 ± 0.32 |
| Glutamine | 6.15 ± 0.27 | 6.64 ± 0.11 |
| GABA | 2.79 ± 0.09 | 2.79 ± 0.07 |
| Aspartate | 1.44 ± 0.08 | 1.44 ± 0.11 |
The concentration of brain acetyl-CoA was significantly lower in G1D mice relative to control animals.
Conversely, TCA cycle intermediates and their derivatives such as glutamate, glutamine, GABA and aspartate were comparable between both animal groups, suggesting that alternative fuels may potentially replenish TCA cycle, maintaining their intermediates and byproducts at normal concentrations.
Values expressed as mean ± SEM. Statistics were performed with Wilcoxon rank test.
P <0.05
TABLE 2.
Amino acids in cortex, thalamus and striatum in G1D.
| STRIATUM (μmol/g) | Control | G1D |
|---|---|---|
| GLUTAMATE | 12.26 ± 0.66 | 11.14 ± 1.27 |
| GLUTAMINE | 4.87 ± 0.25 | 5.46 ± 0.68 |
| GABA | 3.64 ± 0.18 | 3.15 ± 0.22 |
| ASPARTATE | 2.38 ± 0.12 | 2.04 ± 0.26 |
| ALANINE | 0.77 ± 0.03 | 0.76 ± 0.08 |
| THALAMUS (μmol/g) | Control | G1D |
| GLUTAMATE | 9.97 ± 0.31 | 9.05 ± 0.78 |
| GLUTAMINE | 4.95 ± 0.06 | 5.12 ± 0.46 |
| GABA | 5.10 ± 0.26 | 4.24 ± 0.45 |
| ASPARTATE | 3.82 ± 0.11 | 3.28 ± 0.37 |
| ALANINE | 0.57 ± 0.01 | 0.59 ± 0.06 |
| CORTEX (μmol/g) | Control | G1D |
| GLUTAMATE | 17.85 ± 2.59 | 15.99 ± 1.58 |
| GLUTAMINE | 4.60 ± 0.38 | 4.97 ± 0.38 |
| GABA | 2.53 ± 0.24 | 2.31 ± 0.23 |
| ASPARTATE | 2.37 ± 0.34 | 2.08 ± 0.22 |
| ALANINE | 0.87 ± 0.07 | 0.88 ± 0.06 |
Glutamate, glutamine, GABA, aspartate and alanine abundance were determined in cortex, thalamus and striatum in the same animals from which biogenic amines were assayed (Supplementary Table 2).
Overall, there were no statistical differences in the amino acid levels in any of the brain regions studied, consistent with values obtained from forebrains of both animal groups represented in Table 1.
Values expressed as mean ± SEM.
Brain free fatty acids are decreased and cholesterol and triglycerides are preserved in G1D
Because brain lipids are primarily synthesized in the brain from ketone-derived and glucose-derived acetyl-CoA (Koper et al., 1981; Koper et al., 1984; Webber and Edmond, 1979), we evaluated whether diminished levels of acetyl-CoA in G1D limited lipid abundance in the brain. Free fatty acids, triglycerides, total and free cholesterol were quantified in brain extracts of G1D and control mice (n=6 for both groups, age: 4–5 months). The results are depicted in Figure 6, which illustrates depletion of free fatty acids in G1D brain compared to control, whereas cholesterol and triglycerides levels were equivalent in both groups. The diminished levels of brain fatty acids in G1D suggest that their synthesis may be impaired under chronic brain glucose deprivation (perhaps due to decreased levels of glucose-derived acetyl-CoA) and/or that synthetic flux from fatty acids to produce triglycerides and cholesterol esters may be increased.
FIGURE 6. Cerebral free fatty acids, cholesterol and triglycerides in G1D.

Lipids were measured in brain extracts of G1D and control (C) mice (n=6, age: 4–5 months) in the fed state. Lower concentration of fatty acids in brain of G1D mice relative to controls was identified, whereas cholesterol (total and free) and triglycerides were equally abundant in both groups.
Plasma ketones and free fatty acids are elevated in G1D
Under chronic brain glucose deprivation caused by G1D, exogenous or endogenous substrates (i.e., ketone bodies and fatty acids) may serve as alternative fuels to maintain neural function. The ketogenic diet (KD) has proven effective in controlling seizures and other paroxysmal events and in ameliorating brain growth reduction associated with G1D (Friedman et al., 2006; Leary et al., 2003; Perez-Duenas et al., 2009). To assess whether plasma levels of the main alternative brain fuels were altered in G1D, the concentration of plasma total ketone bodies, β-hydroxybutyrate and free fatty acids, and of blood glucose was determined in G1D and normal mice (n=6 in each group, age: 4–5 months) in the postprandial (non-fasting) state. Table 3 illustrates that, while glucose levels were not significantly different between the two animal groups, total ketone bodies, β-hydroxybutyrate and free fatty acid concentrations were markedly increased in G1D. These observations imply that G1D mice exhibit ketosis that can result from either feeding limitations due to motor impediment and/or constitutes a metabolic adaptation to ameliorate the symptoms associated with G1D. Support for the latter hypothesis over motor incapacity and chronic malnutrition is provided by the normal fertility rates, breeding capacity and normal lifespan of G1D mice relative to normal littermates, even in progeny from G1D inbred mating (data not shown).
TABLE 3.
Plasma levels of glucose, ketones and free fatty acids in G1D.
| Plasma metabolites | Control | G1D |
|---|---|---|
| Glucose (mg/dl) | 143.8 ± 27.1 | 119.5 ± 28.5 |
| Total ketone bodies (μmol/L) | 87.0 ± 7.5 | 157.9 ± 25.7* |
| β-hydroxybutyrate (μmol/L) | 69.2 ± 6.0 | 122.2 ± 20.1* |
| Free fatty acids (mmol/L) | 0.56 ± 0.02 | 0.88 ± 0.02** |
Blood was collected from G1D and control mice (n=6, age: 4–5 months) in the fed state. While glucose levels were comparable between both animal groups, G1D mice exhibited a significant increase in β-hydroxybutyrate and free fatty acids relative to normal animals.
Results expressed as mean ± SEM.
P <0.05,
P<0.01.
Biogenic amine neurotransmitters are preserved in G1D
To evaluate the potential role of biogenic amines in the pathophysiology of movement disorders in G1D mice, levels of dopamine, serotonin, and their byproducts were measured in the major brain regions involved in motor function, namely cortex, thalamus and striatum, in both groups G1D and normal animals (n=5 for both groups, age: 2–3.5 months). There was no significant difference in the biogenic amine levels in those brain regions (Supplementary Table 1). These results corroborate sporadic clinical observations made in the course of biogenic amine analysis of human G1D cerebrospinal fluid (JMP, personal observation) and argue against an impaired synthesis of brain biogenic amines related in G1D to account for the significant motor dysfunction of G1D animals.
DISCUSSION
In the present work we have examined, for the first time, the metabolic phenotype and neurophysiological features of a murine model of G1D that recapitulates the defining features of the common form of human G1D encephalopathy. In contrast to previous animal models of G1D (Ohtsuki et al., 2006; Wang et al., 2006), these animals manifested prominent movement disorders that resemble those of G1D patients, such as tremor and ataxia. In addition, G1D animals exhibited frequent generalized jerks which, together with the presence of repetitive spike and spike-wave discharges in the EEG (Figure 3), were consistent with epileptiform activity. The spike-wave discharges were associated with an increase in theta frequency content, which has been reported in other mouse models of absence epilepsy (Hosford et al., 1997; Tan et al., 2007; Tan et al., 2008; Kase et al. 2012). The decreased expression of the GLUT-1 protein and limited changes in GLUT-3 abundance in forebrain, cortex and thalamus in G1D mice had its functional correlate in a regional reduction of brain deoxyglucose concentration observed by 14C-2DG autoradiography studies, in agreement with FDG-PET findings in G1D patients (Pascual et al., 2002; Pascual et al., 2007). Murine G1D was also associated with diminished body and brain growth. Regarding the potential source of the epileptic activity typical of the most common form of G1D, the simplest interpretation of the characteristic human spike-wave pattern is thalamocortical hypersynchronization. Our data are compatible with thalamocortical synchronization as an important mechanism in G1D epileptogenesis. Based on other models of thalamocortical seizures, epilepsy in G1D is potentially associated at least with intrinsic cortical hyperexcitability and or with driven cortical excitability arising from failure of internal thalamic inhibitory mechanisms that propagate excitation to the cortex. Excessive, synchronized corticothalamic input can strengthen the oscillatory network that is dysregulated in absence epilepsies (Cope et al., 2009) and evidence from thalamocortical slices is compatible with this contention. Taken together, these phenotypic features establish the strength of the G1D mouse model.
Because glucose contributes most energy and carbon to brain cells, we investigated whether GLUT-1 deficiency impairs the synthesis of key molecules involved in energy production and neurotransmission such as acetyl-CoA, TCA cycle intermediates and other derivatives. In brain, acetyl-CoA is mainly produced from glucose and its main function is to supply carbon to the TCA cycle for energy production (Williamson and Cooper, 1980). Brain acetyl-CoA is also essential for the synthesis of lipids, such as fatty acids, cholesterol and triglycerides (Koper et al., 1981; Marin-Valencia et al., 2010). As illustrated in Table 1 and in Table 2, acetyl-CoA levels were decreased in G1D. In contrast, cerebral TCA cycle intermediates and derivatives such as glutamine, aspartate, alanine and the neurotransmitters glutamate and GABA determined in forebrain, cortex, thalamus and striatum were not significantly different between the animal groups (normal and G1D; aside from a suggestion of minimally decreased GABA contents in G1D), in agreement with the contention that, in G1D: 1) acetyl-CoA primarily serves as a precursor of TCA cycle intermediates, which may potentially compromise other acetyl-CoA-dependent pathways such as lipid synthesis necessary for myelin deposition in the brain; and/or 2) alternative anaplerotic substrates (i.e. those capable of refilling TCA cycle precursors (Marin-Valencia et al., 2010)) may contribute to the replenishment of TCA cycle intermediates. As a first approximation to this adaptive mechanism, we measured brain free fatty acids, cholesterol and triglycerides and also blood levels of glucose, ketones and free fatty acids in G1D. As illustrated in Figure 6, brain fatty acids were depleted in transgenic mice, while total and free cholesterol and triglycerides were comparably abundant in G1D and normal mice. This finding, together with the observation that G1D animals exhibit elevated plasma levels of ketones and fatty acids and normal blood glucose concentration (Table 3), suggests that in G1D: 1) biosynthesis of fatty acids may be impaired due to depletion of glucose-derived acetyl-CoA; 2) elevated levels of plasma ketones and free fatty acids in the G1D mouse does not completely compensate the depletion of brain acetyl-CoA in G1D. Further studies will elucidate the hypotheses that arise directly from these results.
Whether G1D impacts the synthesis and regulation of other molecules implicated in cognitive and motor functions, such as biogenic amines dopamine and serotonin (Marin-Valencia et al., 2008), has also been underexplored, especially in the context of selectively preserved striatal deoxyglucose concentration relative to the rest of the human brain in G1D (Pascual et al., 2002). To this end, the G1D model was investigated analytically after regional dissection: The concentration of dopamine, serotonin, and their byproducts in cortex, thalamus and striatum was normal in G1D. As illustrated in Supplementary Table 1, dopamine and its byproducts HVA and DOPAC reached higher concentrations in the striatum and thalamus and, to a lesser degree, in cortex, but all brain regions exhibited similar abundance in G1D relative to normal mice.
The activity of the glutamate-glutamine cycle may be compromised in certain forms of epilepsy (Eid et al., 2008; Sepkuty et al., 2002). Astrocytes are an integral part of the cycle by virtue of uptake of neuronal glutamate and conversion to glutamine via glutamine synthetase. Glutamine is transported back to presynaptic terminals and converted to glutamate by the mitochondrial enzyme glutaminase (E.C. 3.5.1.2), which is released to the synaptic cleft or converted to GABA. Various forms of epilepsy (especially temporal lobe epilepsy) have been associated with reactive astrocytosis (Eid et al., 2004; Eid et al., 2008; Ortinski et al., 2010). Reactive astrocytes represent a cellular response to many forms of brain injury or disease (Sofroniew, 2005), and are characterized by cellular hypertrophy and enhanced expression of glial fibrillary acidic protein (GFAP) (Pekny and Nilsson, 2005). In addition to these morphologic changes, reactive astrocytes found in temporal lobe epilepsy (Eid et al., 2004) and in virus-induced models of reactive astrocytosis (Ortinski et al., 2010) also manifest a reduced expression of glutamine synthetase. This finding has led the hypothesis that glutamate-glutamine cycle deficits associated with reactive astrocytosis may be relevant to the pathogenesis of epilepsy (Eid et al., 2008; Liang et al., 2006; Wetherington et al., 2008). In G1D, reactive astrocytosis is present in the cortex of adult mice (Ullner et al., 2009). In agreement with this previous work, we observed an increase of reactive astrocytes, a form of minimal brain lesion (Kraig et al., 1991) in G1D (Figure 5), which was more prominent in older mice. However, as illustrated in Figures 5A and 5B, glutamine synthetase expression was not reduced in reactive astrocytes of G1D mice 1 and 3 months of age relative to normal littermates. In addition, glutamine levels in forebrain, cortex, thalamus and striatum were not statistically different between both animal groups (Table 2). If, in the G1D brain, most glutamine derives from glucose as it occurs in the normal brain (Drewes et al., 1977; Felig et al., 1973; Wahren et al., 1999), the results do not support the hypothesis that deficits in glutamate-glutamine cycle due to depletion of glutamine synthetase in reactive astrocytes contribute to the pathogenesis of epilepsy in G1D.
In light of the unsuspected finding of intact TCA cycle precursors in G1D presented in this work, a reassessment of the pathophysiology of the disorder becomes necessary: We, with others, had universally assumed that encephalopathy in G1D patients must derive from energy failure (defined as a reduction in flux through the main biochemical pathway responsible for cerebral energy metabolism in correlation with diminished mass action stemming from decreased glucose brain accumulation and conveyed throughout glycolysis and the TCA cycle) because of the potential of diminished brain glucose transporter expression to significantly limit brain glucose entry (De Vivo et al., 1991; Klepper et al., 2004; Pascual et al., 2002; Pascual et al., 2007; Perez-Duenas et al., 2009). Consistent with this postulate, brain fuel replacement using a ketogenic diet usually results in significant improvement of epilepsy and extrapyramidal symptoms (i.e., choreoatetosis, dystonia and ataxia) in patients with G1D (De Vivo et al., 1991; Friedman et al., 2006; Perez-Duenas et al., 2009). In contrast, the data are compatible with aerobic metabolism (derived from the action of the neuronal TCA cycle, which contributes most brain energy) preservation in G1D, such that mechanisms other than impaired aerobic glycolysis must be responsible for the disorder manifestations, in a fashion -at least superficially- reminiscent of hypoglycemic brain damage (Auer et al., 1986). One such potential mechanism is reduced lactate transfer generated via anaerobic glycolysis from the astrocyte into the neuron and reduced anaerobic ATP formation in the astrocyte impacting glutamate-glutamine recycling (Magistretti and Pellerin, 1996), thus placing new emphasis on G1D primarily as a glial disease. However, the functional relevance of neurotransmitter cycling may vary across brain regions, especially in cortical relative to thalamic brain slices (Kam and Nicoll, 2007; Tani et al., 2010), such that further work will be needed to validate these observations in vivo.
CONCLUSION
In summary, we have described the general phenotypic, electrophysiological, cerebral and somatic metabolic features of antisense transgenic mice exhibiting a severe phenotype of G1D. These mice manifested clinical features that closely resemble the most common human phenotype, which includes predominantly movement disorders and seizures. Biogenic amines were not decreased in G1D mice, implying that the movement disorders associated with the disease are not related to particular deficits of these neurotransmitters or their byproducts. In addition, brain glutamine (particularly in cortex) and glutamine synthetase expression in cortical reactive astrocytes were preserved in G1D mice, suggesting that the mechanism of epilepsy is not primarily related to glutamine deficits. Strikingly, acetyl-CoA and fatty acid contents were diminished in the brain of G1D mice, while TCA cycle intermediate, amino acid and neurotransmitter contents were normal. Thus, there is no basis to suspect TCA cycle-related energy failure associated with G1D, at least as it relates to aerobic metabolism derived from glycolysis. The G1D mouse model and findings presented here allow the formulation of new testable hypotheses related to anaerobic glycolysis, fatty acid synthesis and flux from fatty acids to triglyceride and cholesterol esters in G1D as mechanisms potentially responsible for epileptogenesis and microencephaly, while providing justification for focusing attention on thalamocortical hypersynchronization in G1D.
Supplementary Material
Highlights.
A new mouse model of GLUT-1 deficiency allowed for electrophysiological and metabolic analysis
Thalamocortical oscillations are potentially relevant to the epileptic phenotype of GLUT-1 deficiency
Aerobic energy metabolism related to the Krebs cycle is intact in the mouse model, in contrast with increased lipid metabolism
Thus, we contest the contention that decreased brain glucose transport causes energy failure
Acknowledgments
We would like to acknowledge the assistance of Fundación Caja Madrid (IMV), NINDS F32NS065640 (LBG), NCRR 5P41RR002584 (JMP), the Dallas Women’s Foundation (Billingsley Fund) (JMP) and the Juvenile Diabetes Research Foundation (1-2004-698), Dialysis Clinics Inc. (C-2957), and the American Diabetes Association (7-02-RA-34) (CWH). We also thank Drs. Craig R. Malloy for helpful discussions and Shawn Burgess for assistance with lipid determinations. The assistance of Drs. John Shelton and James Richardson (UT Southwestern Medical Center) with autoradiography experiments and of Drs. Michelle Puchowicz and Henri Brunengraber at the Case Western Reserve University National Mouse Metabolic Phenotyping Center (supported by NIDDK 1U24DK076174) is also greatly appreciated.
Footnotes
Abbreviations: NMR: nuclear magnetic resonance; TCA: tricarboxylic acid; Glut1: Glucose transporter type I; G1D: Glut1 deficiency; acetyl-CoA: acetyl-coenzyme A
Publisher's Disclaimer: This is a PDF file of an unedited manuscript that has been accepted for publication. As a service to our customers we are providing this early version of the manuscript. The manuscript will undergo copyediting, typesetting, and review of the resulting proof before it is published in its final citable form. Please note that during the production process errors may be discovered which could affect the content, and all legal disclaimers that apply to the journal pertain.
References
- Aubert A, et al. A coherent neurobiological framework for functional neuroimaging provided by a model integrating compartmentalized energy metabolism. Proc Natl Acad Sci U S A. 2007;104:4188–93. doi: 10.1073/pnas.0605864104. [DOI] [PMC free article] [PubMed] [Google Scholar]
- Auer RN. Hypoglycemic brain damage. Metab Brain Dis. 2004;19:169–75. doi: 10.1023/b:mebr.0000043967.78763.5b. [DOI] [PubMed] [Google Scholar]
- Auer RN, et al. Hypotension as a complication of hypoglycemia leads to enhanced energy failure but no increase in neuronal necrosis. Stroke. 1986;17:442–9. doi: 10.1161/01.str.17.3.442. [DOI] [PubMed] [Google Scholar]
- Barros LF, et al. A quantitative overview of glucose dynamics in the gliovascular unit. Glia. 2007;55:1222–37. doi: 10.1002/glia.20375. [DOI] [PubMed] [Google Scholar]
- Barros LF, et al. Why glucose transport in the brain matters for PET. Trends Neurosci. 2005;28:117–9. doi: 10.1016/j.tins.2005.01.002. [DOI] [PubMed] [Google Scholar]
- Carruthers A, et al. Will the original glucose transporter isoform please stand up! Am J Physiol Endocrinol Metab. 2009;297:E836–48. doi: 10.1152/ajpendo.00496.2009. [DOI] [PMC free article] [PubMed] [Google Scholar]
- Chaim-Matyas A, et al. Encapsulation of the cobra cytotoxin P4 in liposomes. Biotechnol Appl Biochem. 1993;17(Pt 1):31–6. [PubMed] [Google Scholar]
- Cope DW, et al. Enhanced tonic GABAA inhibition in typical absence epilepsy. Nat Med. 2009;15:1392–8. doi: 10.1038/nm.2058. [DOI] [PMC free article] [PubMed] [Google Scholar]
- De Vivo DC, et al. Defective glucose transport across the blood-brain barrier as a cause of persistent hypoglycorrhachia, seizures, and developmental delay. N Engl J Med. 1991;325:703–9. doi: 10.1056/NEJM199109053251006. [DOI] [PubMed] [Google Scholar]
- Drewes LR, et al. Net amino acid transport between plasma and erythrocytes and perfused dog brain. Am J Physiol. 1977;233:E320–5. doi: 10.1152/ajpendo.1977.233.4.E320. [DOI] [PubMed] [Google Scholar]
- Eid T, et al. Loss of glutamine synthetase in the human epileptogenic hippocampus: possible mechanism for raised extracellular glutamate in mesial temporal lobe epilepsy. Lancet. 2004;363:28–37. doi: 10.1016/s0140-6736(03)15166-5. [DOI] [PubMed] [Google Scholar]
- Eid T, et al. Glutamate and astrocytes--key players in human mesial temporal lobe epilepsy? Epilepsia. 2008;49(Suppl 2):42–52. doi: 10.1111/j.1528-1167.2008.01492.x. [DOI] [PubMed] [Google Scholar]
- Ersser RS, Davey JF. Liquid chromatographic analysis of amino acids in physiological fluids: recent advances. Med Lab Sci. 1991;48:59–71. [PubMed] [Google Scholar]
- Felig P, et al. Uptake of individual amino acids by the human brain. Proc Soc Exp Biol Med. 1973;142:230–1. doi: 10.3181/00379727-142-36994. [DOI] [PubMed] [Google Scholar]
- Folch J, et al. A simple method for the isolation and purification of total lipides from animal tissues. J Biol Chem. 1957;226:497–509. [PubMed] [Google Scholar]
- Friedman JR, et al. Atypical GLUT1 deficiency with prominent movement disorder responsive to ketogenic diet. Mov Disord. 2006;21:241–5. doi: 10.1002/mds.20660. [DOI] [PubMed] [Google Scholar]
- Heilig C, et al. Implications of glucose transporter protein type 1 (GLUT1)-haplodeficiency in embryonic stem cells for their survival in response to hypoxic stress. Am J Pathol. 2003a;163:1873–85. doi: 10.1016/S0002-9440(10)63546-8. [DOI] [PMC free article] [PubMed] [Google Scholar]
- Heilig C, et al. Transgenic mouse model for the human GLUT1-deficiency syndrome. Ann Neurol. 2004;56:S12. [Google Scholar]
- Heilig CW, et al. Glucose transporter-1-deficient mice exhibit impaired development and deformities that are similar to diabetic embryopathy. Proc Natl Acad Sci U S A. 2003b;100:15613–8. doi: 10.1073/pnas.2536196100. [DOI] [PMC free article] [PubMed] [Google Scholar]
- Hosford DA, et al. Differential effects mediated by GABAA receptors in thalamic nuclei in lh:lh model of absence seizures. Epilepsy Res. 1997;27:55–65. doi: 10.1016/s0920-1211(97)01023-1. [DOI] [PubMed] [Google Scholar]
- Jolivet R, et al. Comment on recent modeling studies of astrocyte-neuron metabolic interactions. J Cereb Blood Flow Metab. 2010;30:1982–6. doi: 10.1038/jcbfm.2010.132. [DOI] [PMC free article] [PubMed] [Google Scholar]
- Kam K, Nicoll R. Excitatory synaptic transmission persists independently of the glutamate-glutamine cycle. J Neurosci. 2007;27:9192–200. doi: 10.1523/JNEUROSCI.1198-07.2007. [DOI] [PMC free article] [PubMed] [Google Scholar]
- Kase D, et al. Roles of the subthalamic nucleus and subthalamic HCN channels in absence seizures. 2012. J Neurophysiol. 2012;107:393–406. doi: 10.1152/jn.00937.2010. [DOI] [PubMed] [Google Scholar]
- Klepper J, et al. Effects of the ketogenic diet in the glucose transporter 1 deficiency syndrome. Prostaglandins Leukot Essent Fatty Acids. 2004;70:321–7. doi: 10.1016/j.plefa.2003.07.004. [DOI] [PubMed] [Google Scholar]
- Kombu RS, et al. Analysis of the citric acid cycle intermediates using gas chromatography-mass spectrometry. Methods Mol Biol. 2011;708:147–57. doi: 10.1007/978-1-61737-985-7_8. [DOI] [PubMed] [Google Scholar]
- Koper JW, et al. Preferential utilization of ketone bodies for the synthesis of myelin cholesterol in vivo. Biochim Biophys Acta. 1981;666:411–7. doi: 10.1016/0005-2760(81)90300-3. [DOI] [PubMed] [Google Scholar]
- Koper JW, et al. Acetoacetate and glucose as substrates for lipid synthesis by rat brain oligodendrocytes and astrocytes in serum-free culture. Biochim Biophys Acta. 1984;796:20–6. doi: 10.1016/0005-2760(84)90233-9. [DOI] [PubMed] [Google Scholar]
- Kraig RP, et al. Spreading depression increases immunohistochemical staining of glial fibrillary acidic protein. J Neurosci. 1991;11:2187–98. doi: 10.1523/JNEUROSCI.11-07-02187.1991. [DOI] [PMC free article] [PubMed] [Google Scholar]
- Leary LD, et al. Seizure characterization and electroencephalographic features in Glut-1 deficiency syndrome. Epilepsia. 2003;44:701–7. doi: 10.1046/j.1528-1157.2003.05302.x. [DOI] [PubMed] [Google Scholar]
- Liang SL, et al. Dynamic regulation of synaptic GABA release by the glutamate-glutamine cycle in hippocampal area CA1. J Neurosci. 2006;26:8537–48. doi: 10.1523/JNEUROSCI.0329-06.2006. [DOI] [PMC free article] [PubMed] [Google Scholar]
- Magistretti PJ, Pellerin L. Cellular mechanisms of brain energy metabolism. Relevance to functional brain imaging and to neurodegenerative disorders. Ann N Y Acad Sci. 1996;777:380–7. doi: 10.1111/j.1749-6632.1996.tb34449.x. [DOI] [PubMed] [Google Scholar]
- Mangia S, et al. Response to ‘comment on recent modeling studies of astrocyte-neuron metabolic interactions’: much ado about nothing. J Cereb Blood Flow Metab. 2011;31:1346–53. doi: 10.1038/jcbfm.2011.29. [DOI] [PMC free article] [PubMed] [Google Scholar]
- Mangia S, et al. The in vivo neuron-to-astrocyte lactate shuttle in human brain: evidence from modeling of measured lactate levels during visual stimulation. J Neurochem. 2009;109(Suppl 1):55–62. doi: 10.1111/j.1471-4159.2009.06003.x. [DOI] [PMC free article] [PubMed] [Google Scholar]
- Marin-Valencia I, et al. Pyruvate carboxylase deficiency: mechanisms, mimics and anaplerosis. Mol Genet Metab. 2010;101:9–17. doi: 10.1016/j.ymgme.2010.05.004. [DOI] [PubMed] [Google Scholar]
- Marin-Valencia I, et al. Biochemical diagnosis of dopaminergic disturbances in paediatric patients: analysis of cerebrospinal fluid homovanillic acid and other biogenic amines. Clin Biochem. 2008;41:1306–15. doi: 10.1016/j.clinbiochem.2008.08.077. [DOI] [PubMed] [Google Scholar]
- Ohtsuki S, et al. Modulation and compensation of the mRNA expression of energy related transporters in the brain of glucose transporter 1-deficient mice. Biol Pharm Bull. 2006;29:1587–91. doi: 10.1248/bpb.29.1587. [DOI] [PubMed] [Google Scholar]
- Ortinski PI, et al. Selective induction of astrocytic gliosis generates deficits in neuronal inhibition. Nat Neurosci. 2010;13:584–91. doi: 10.1038/nn.2535. [DOI] [PMC free article] [PubMed] [Google Scholar]
- Pascual JM, et al. Epilepsy in inherited metabolic disorders. Neurologist. 2008;14:S2–S14. doi: 10.1097/01.nrl.0000340787.30542.41. [DOI] [PubMed] [Google Scholar]
- Pascual JM, et al. Imaging the metabolic footprint of Glut1 deficiency on the brain. Ann Neurol. 2002;52:458–64. doi: 10.1002/ana.10311. [DOI] [PubMed] [Google Scholar]
- Pascual JM, et al. Brain glucose supply and the syndrome of infantile neuroglycopenia. Arch Neurol. 2007;64:507–13. doi: 10.1001/archneur.64.4.noc60165. [DOI] [PubMed] [Google Scholar]
- Pascual JM, et al. GLUT1 deficiency and other glucose transporter diseases. Eur J Endocrinol. 2004;150:627–33. doi: 10.1530/eje.0.1500627. [DOI] [PubMed] [Google Scholar]
- Pekny M, Nilsson M. Astrocyte activation and reactive gliosis. Glia. 2005;50:427–34. doi: 10.1002/glia.20207. [DOI] [PubMed] [Google Scholar]
- Pellerin L, et al. Activity-dependent regulation of energy metabolism by astrocytes: an update. Glia. 2007;55:1251–62. doi: 10.1002/glia.20528. [DOI] [PubMed] [Google Scholar]
- Pellerin L, Magistretti PJ. Neuroenergetics: calling upon astrocytes to satisfy hungry neurons. Neuroscientist. 2004a;10:53–62. doi: 10.1177/1073858403260159. [DOI] [PubMed] [Google Scholar]
- Pellerin L, Magistretti PJ. Neuroscience. Let there be (NADH) light. Science. 2004b;305:50–2. doi: 10.1126/science.1100428. [DOI] [PubMed] [Google Scholar]
- Perez-Duenas B, et al. Childhood chorea with cerebral hypotrophy: a treatable GLUT1 energy failure syndrome. Arch Neurol. 2009;66:1410–4. doi: 10.1001/archneurol.2009.236. [DOI] [PubMed] [Google Scholar]
- Schurr A. Neuronal energy requirements. In: Walz W, editor. The neuronal environment: brain homeostasis in health and disease. Humana Press; New Jersey: 2002. pp. 25–54. [Google Scholar]
- Seifert G, et al. Astrocyte dysfunction in neurological disorders: a molecular perspective. Nat Rev Neurosci. 2006;7:194–206. doi: 10.1038/nrn1870. [DOI] [PubMed] [Google Scholar]
- Sepkuty JP, et al. A neuronal glutamate transporter contributes to neurotransmitter GABA synthesis and epilepsy. J Neurosci. 2002;22:6372–9. doi: 10.1523/JNEUROSCI.22-15-06372.2002. [DOI] [PMC free article] [PubMed] [Google Scholar]
- Simpson IA, et al. Supply and demand in cerebral energy metabolism: the role of nutrient transporters. J Cereb Blood Flow Metab. 2007;27:1766–91. doi: 10.1038/sj.jcbfm.9600521. [DOI] [PMC free article] [PubMed] [Google Scholar]
- Sinton CM, et al. Validation of a novel method to interrupt sleep in the mouse. J Neurosci Methods. 2009;184:71–8. doi: 10.1016/j.jneumeth.2009.07.026. [DOI] [PubMed] [Google Scholar]
- Sofroniew MV. Reactive astrocytes in neural repair and protection. Neuroscientist. 2005;11:400–7. doi: 10.1177/1073858405278321. [DOI] [PubMed] [Google Scholar]
- Tan HO, et al. Reduced cortical inhibition in a mouse model of familial childhood absence epilepsy. Proc Natl Acad Sci. 2007;104:17536–17541. doi: 10.1073/pnas.0708440104. [DOI] [PMC free article] [PubMed] [Google Scholar]
- Tan HO, et al. Increased thalamic inhibition in the absence seizure prone DBA/2J mouse. Epilepsia. 2008;49:921–925. doi: 10.1111/j.1528-1167.2008.01536.x. [DOI] [PMC free article] [PubMed] [Google Scholar]
- Tani H, et al. Glutamine is required for persistent epileptiform activity in the disinhibited neocortical brain slice. J Neurosci. 2010;30:1288–300. doi: 10.1523/JNEUROSCI.0106-09.2010. [DOI] [PMC free article] [PubMed] [Google Scholar]
- Ullner PM, et al. Murine Glut-1 transporter haploinsufficiency: postnatal deceleration of brain weight and reactive astrocytosis. Neurobiol Dis. 2009;36:60–9. doi: 10.1016/j.nbd.2009.06.014. [DOI] [PMC free article] [PubMed] [Google Scholar]
- Wahren J, et al. Brain substrate utilisation during acute hypoglycaemia. Diabetologia. 1999;42:812–8. doi: 10.1007/s001250051231. [DOI] [PubMed] [Google Scholar]
- Wang D, et al. A mouse model for Glut-1 haploinsufficiency. Hum Mol Genet. 2006;15:1169–79. doi: 10.1093/hmg/ddl032. [DOI] [PubMed] [Google Scholar]
- Webber RJ, Edmond J. The in vivo utilization of acetoacetate, D-(−)-3-hydroxybutyrate, and glucose for lipid synthesis in brain in the 18-day-old rat. Evidence for an acetyl-CoA bypass for sterol synthesis. J Biol Chem. 1979;254:3912–20. [PubMed] [Google Scholar]
- Wetherington J, et al. Astrocytes in the epileptic brain. Neuron. 2008;58:168–78. doi: 10.1016/j.neuron.2008.04.002. [DOI] [PMC free article] [PubMed] [Google Scholar]
- Williamson JR, Cooper RH. Regulation of the citric acid cycle in mammalian systems. FEBS Lett. 1980;117(Suppl):K73–85. doi: 10.1016/0014-5793(80)80572-2. [DOI] [PubMed] [Google Scholar]
- Willis S, et al. Anticonvulsant effects of a triheptanoin diet in two mouse chronic seizure models. Neurobiol Dis. 2010;40:565–72. doi: 10.1016/j.nbd.2010.07.017. [DOI] [PMC free article] [PubMed] [Google Scholar]
- Zhang GF, et al. Catabolism of 4-hydroxyacids and 4-hydroxynonenal via 4-hydroxy-4-phosphoacyl-CoAs. J Biol Chem. 2009;284:33521–34. doi: 10.1074/jbc.M109.055665. [DOI] [PMC free article] [PubMed] [Google Scholar]
Associated Data
This section collects any data citations, data availability statements, or supplementary materials included in this article.