


Figure 1. Amphetamine and endocannabinoids produce frequency-dependent filtering at corticoaccumbal terminals.
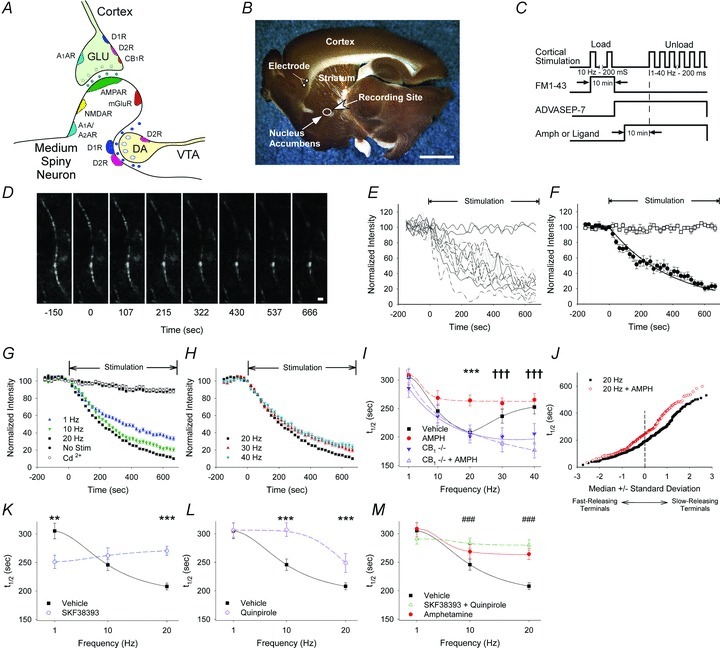
A, cartoon of the basic ‘striatal microcircuit’. GLU, glutamatergic afferent; VTA, ventral tegmental area; DA, dopamine afferent; mGluR, metabotropic glutamate receptor; D, dopamine receptor; A1R and A2R, adenosine receptor; CB1, cannabinoid receptor. B, a sagittal corticoaccumbal slice stained with FM1-43 and 3,3′-diaminobenzidine shows the stimulation and recording regions. Corticoaccumbal terminals from the PFC were stimulated with a bipolar electrode. Two-photon images of corticoaccumbal terminals and electrophysiological recordings in MSNs were obtained within the NAcore (circle within the striatum). Bar, 3 mm. C, protocol for loading and destaining corticoaccumbal terminals with FM1-43. D, stimulation of the PFC in the presence of FM1-43 created labelled puncta, sometimes seen in en passant arrays. Re-stimulation of the PFC at 20 Hz resulted in activity-dependent destaining of most puncta. Stimulation began at t = 0. Bar, 2 μm. E, time-intensity analysis of fluorescent puncta along the axon array, shown in panel D, during unloading demonstrates differential release kinetics. The plateau lines on the graph represents optical measurements from non-destaining fluorescent puncta. F, mean ± SEM fluorescence intensity of destaining and non-destaining puncta shown in panel E. Curve demonstrates exponential fitting for first-order kinetics. G, stimulation of the PFC at 1 Hz, 10 Hz and 20 Hz produced a frequency-dependent increase in FM1-43 destaining reflected by a decrease in FM1-43 destaining. Little FM1-43 destaining occurred when no stimulation was applied or when cadmium (Cd2+) was added to the bath. H, PFC stimulation frequencies of 30 Hz and 40 Hz progressively reduced exocytosis from corticoaccumbal terminals. I, mean destaining half-times (t1/2) of FM1-43 release in slices from WT and CB1−/− mice perfused in vehicle or amphetamine (AMPH). *P < 0.05, **P < 0.01, ***P < 0.001, amphetamine compared with vehicle and †††P < 0.001 for vehicle or amphetamine, compared with data obtained from CB1−/− mice, Mann–Whitney U test. J, normal probability plot comparison of individual half-times of release in slices from WT mice shows that amphetamine reduces FM1-43 release from terminals with lowest probability of release (e.g. those with the highest t1/2). K, distribution of mean t1/2 of release for slices from WT mice exposed to vehicle or the D1R agonist SKF38393 (SKF) at 1, 10 and 20 Hz. For panels K and L, **P < 0.01, ***P < 0.001, Mann–Whitney U test. L, distribution of mean t1/2 of release for slices from WT mice exposed to vehicle or the D2R agonist quinpirole (QUIN) at 1, 10 and 20 Hz. M, distribution of mean t1/2 of release in slices from WT mice exposed to vehicle, amphetamine or to the combination of SKF38393 and quinpirole at 1, 10 and 20 Hz. ###P < 0.001 for SKF38393 with quinpirole, compared with vehicle, Mann–Whitney U test.