


Figure 2.
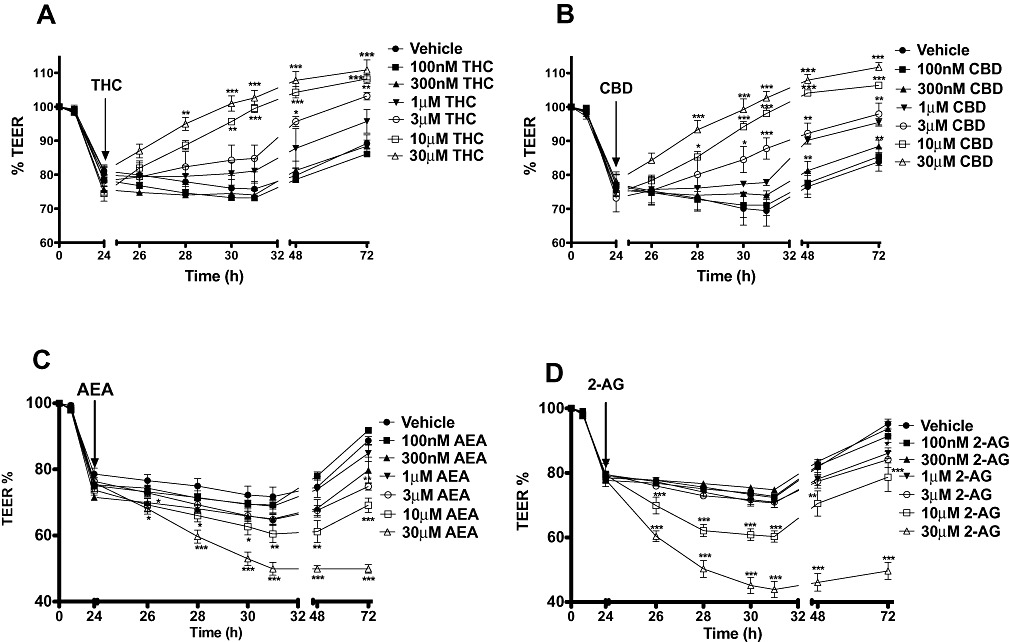
Concentration–response curves to THC (A), CBD (B), AEA (C) and 2-AG (D) applied apically on the fall in TEER caused by cytokine application. Data are given as means with error bars representing SEM. (n= 3, *P < 0.05, **P < 0.01, ***P < 0.001, anova).