


Figure 3. Effects of PV+ and SOM+ activation on FI function.
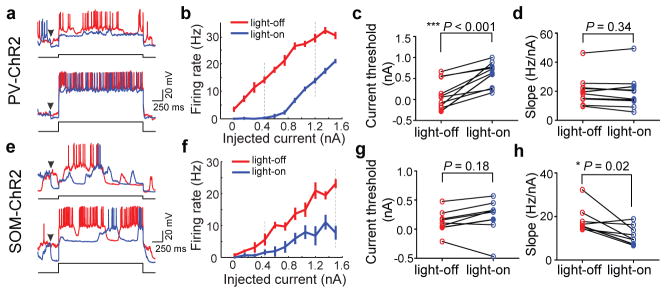
a, Example traces showing neuronal spiking evoked by current injection. Red, voltage trace without laser; blue, with laser. Arrowhead, laser onset (laser offset, 800 ms after current injection, not shown). Current amplitude, 0.45 nA (upper) and 1.2 nA (lower). b, FI curve of the cell shown in a. Red, without laser; blue, with laser. Error bar, ±s.e.m. Dashed lines, current amplitudes shown in a. c, d, Summary of threshold (lowest current that evokes spiking) and FI slope with and without laser. Each symbol represents one cell (n=10). e–h, Similar to a–d, for SOM+ activation (n=8).