


Figure 3.
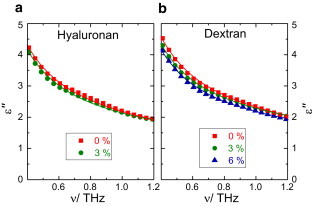
Dielectric loss spectra, ε″(ν), for aqueous solutions of HA (a; w = 0 and 3%) and dextran (b; w = 0, 3, and 6%). (Symbols) Experimental data. (Lines) Fits with two Debye-type relaxations. (See the Supporting Material.)
Official websites use .gov
A
.gov website belongs to an official
government organization in the United States.
Secure .gov websites use HTTPS
A lock (
) or https:// means you've safely
connected to the .gov website. Share sensitive
information only on official, secure websites.
Dielectric loss spectra, ε″(ν), for aqueous solutions of HA (a; w = 0 and 3%) and dextran (b; w = 0, 3, and 6%). (Symbols) Experimental data. (Lines) Fits with two Debye-type relaxations. (See the Supporting Material.)