


Figure 5. VAMP2 and VAMP7 containing vesicles display distinct dynamics and fusion on PDL and LN.
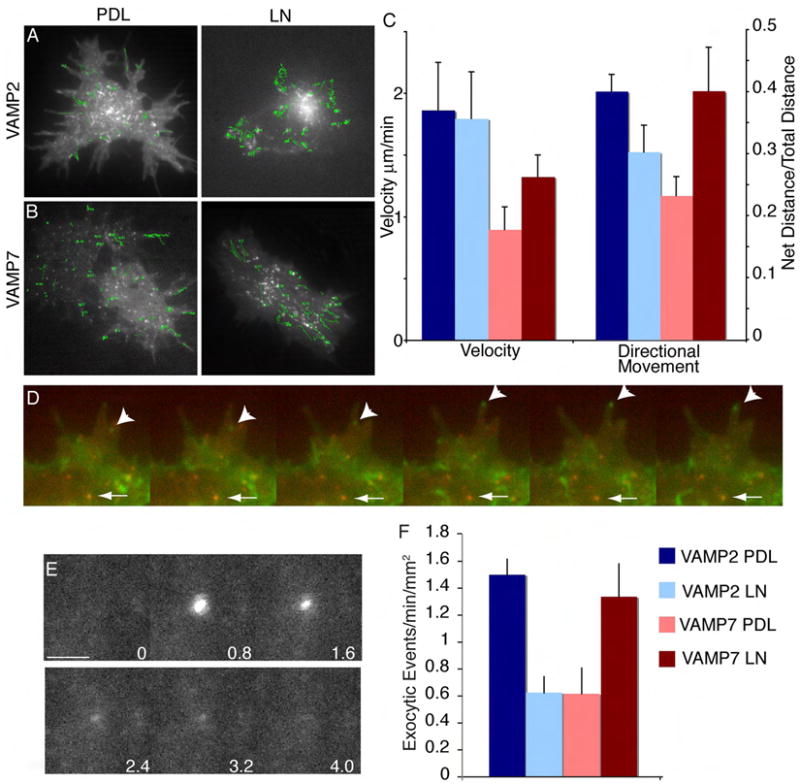
Frames from time lapse of E14.5 CON cortical neurons expressing either GFP-VAMP2 (A) or GFP-VAMP7 (B) plated on PDL or LN imaged 6 hours after plating. Green tracks indicate vesicle position over time. (C) Quantification of vesicle speed and directionality of vesicle movement +/- SEM. Directionality was calculated by dividing the net distance traveled by the total distance traveled by each vesicle; a higher ratio indicates more directional vesicle movement. n ≥ 5 cells/condition, ≥ 30 vesicles/cell, imaged in ≥ 5 consecutive frames. Scale bar is 5 μm. (D) Frames from a time lapse of E14.5 CON neurons expressing GFP-VAMP2 and mcherry-VAMP7. Arrowhead indicates a VAMP2-containg vesicle moving into a filopodia, while the arrow indicates a VAMP7-containing vesicle remaining stationary in a more central region. (E-F) E14.5 CON neurons expressing VAMP2-pHluroin or VAMP7-pHluorin were plated on PDL or LN. After 6 hours, vesicle fusion events on the basal cell membrane were imaged by TIR-FM. (E) Representative images from a time-lapse demonstrate a vesicle fusion event. The fluorescence intensity of pHluorin is low when it is within the vesicle lumen (t=0s). Upon fusion with the plasma membrane, pHluorin is exposed to the higher cytosolic pH, and there is a rapid increase in fluorescence intensity (t=0.8s), followed by a rapid diffusion of fluorescence as the molecules disperse within the plasma membrane (t=1.6-2.4s). The frequency of vesicle fusion +/- SEM is shown in (F). n ≥15 cells/condition. Scale bar is 1 μm.