


Fig. 6.
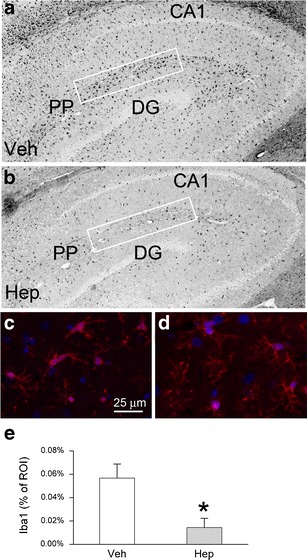
Heparin reduces hippocampal neuroinflammation following SAH. a–d Parasagittal sections immunolabeled for Iba1, shown at low (a, b) and high (c, d) magnification, from rats treated with vehicle (a, c) or heparin (b, d); note the “plump” morphology of microglia in the controls (c), which is absent with heparin (d); CA1 cornu ammonis region 1, PP perforant pathway, DG dentate gurus; the ROI analyzed are depicted by rectangles; the images shown in a and b are “inverse” epifluorescence images. e Bar graph quantifying Iba1 in the ROI in rats treated with vehicle (Veh) or heparin (Hep); *P < 0.05; five rats per group