


Figure 7.
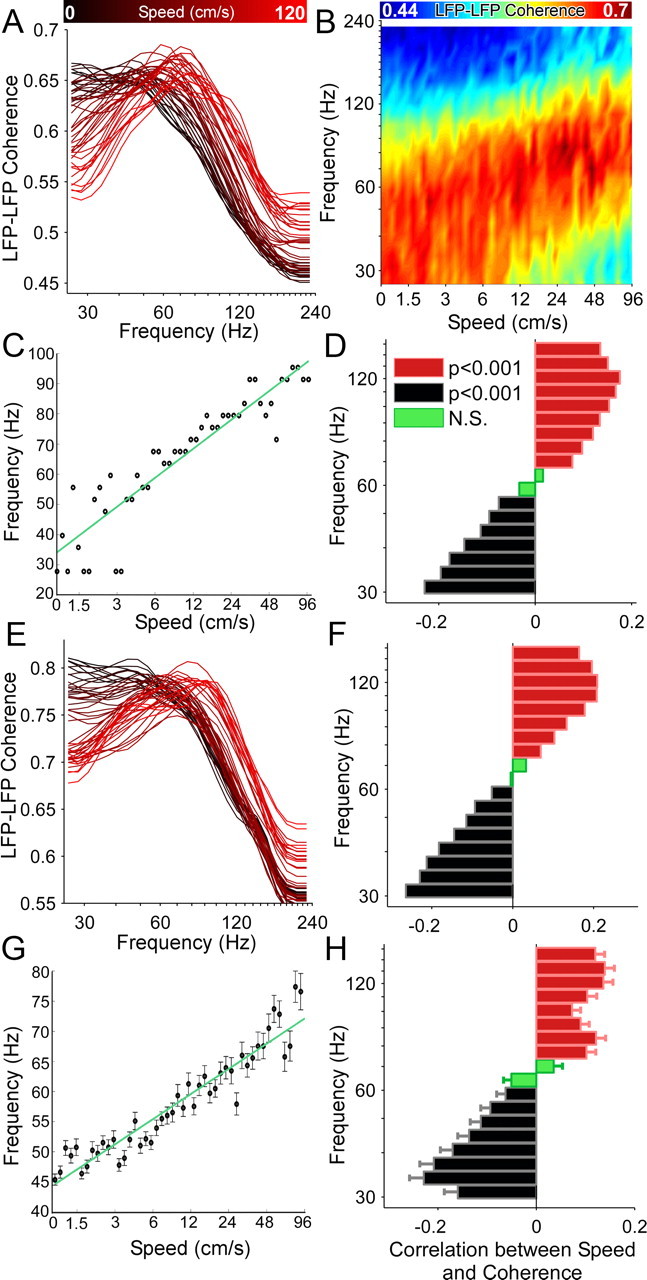
Increased running speed is accompanied by LFP–LFP coherence at higher gamma frequencies. A, Coherence between two hippocampal electrodes provides a measure of the synchrony across the long axis of the hippocampus. Here the coherence between two electrodes in CA1, positioned 0.7 mm apart, is shown at different speeds. Black indicates slow speeds, red indicates faster speeds. The coherence curves shift to higher gamma frequencies as a function of speed. B, The same data as in A, with color-coded coherence. The shift to higher frequencies in the gamma range (30–120 Hz) as a function of increasing speed is clearly visible. C, The running speed of the rat is plotted against the maximally coherent frequency at each speed. These data are from the same LFPs shown in A and B. The most-coherent frequency robustly increases as a function of running speed (r = 0.95, p < 0.001), showing that the frequency of network oscillations shifts to higher frequencies synchronously across the hippocampus at faster speeds. D, The LFP–LFP coherence (same data as A–C) at each frequency band was independently correlated with running speed. Significant negative correlations (black, p < 0.001, Bonferroni-adjusted) were seen for lower frequencies. These correlations became progressively less negative with increasing frequency, transitioning to significant positive correlations ∼70 Hz (red, p < 0.001). Thus coherence and power show very similar relationships to running speed. E, Another example from the same session showing an electrode pair separated by 0.3 mm. Note the higher coherences in this case, but identical shifts to higher frequencies at higher speeds. Color coded as described in A. F, Correlations for the pair shown in E. Color coded as described in D. G, Same as C, but for the entire population data. H, Same as D and F, but for the entire population data.