


Figure 5.
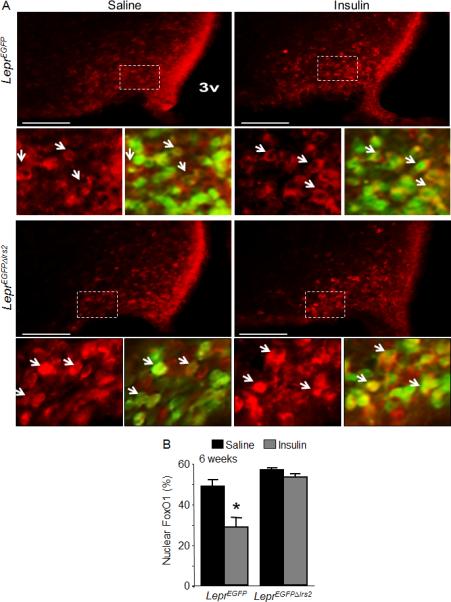
FoxO1 signaling in LeprΔIrs2 –mice. (A) Immunofluorescence for FoxO1 (red) in 6-weeks-old control LeprEGFP and LeprEGFPΔIrs2 mice injected icv with vehicle or insulin (300 mU; 1 hour). Representative images from the hypothalamus of LeprEGFP and LeprEGFPΔIrs2 mice are shown. Scale bar: 100 μm. Lower (small) panels are digital zooms of boxed areas from the top panel, showing FoxO1 (red) alone (left panels) or merged with and EGFP (green) (right panels) in 6-week-old mice of the indicated genotypes. (B) Quantification of LepR-b/EGFP neurons containing nuclear FoxO1 immunoreactivity (n=4/genotype). Data are presented as mean ± SEM; *, p < 0.05.