


Figure 1. EGFR and Aurora-A transcript levels in SCCHN and clinical outcome.
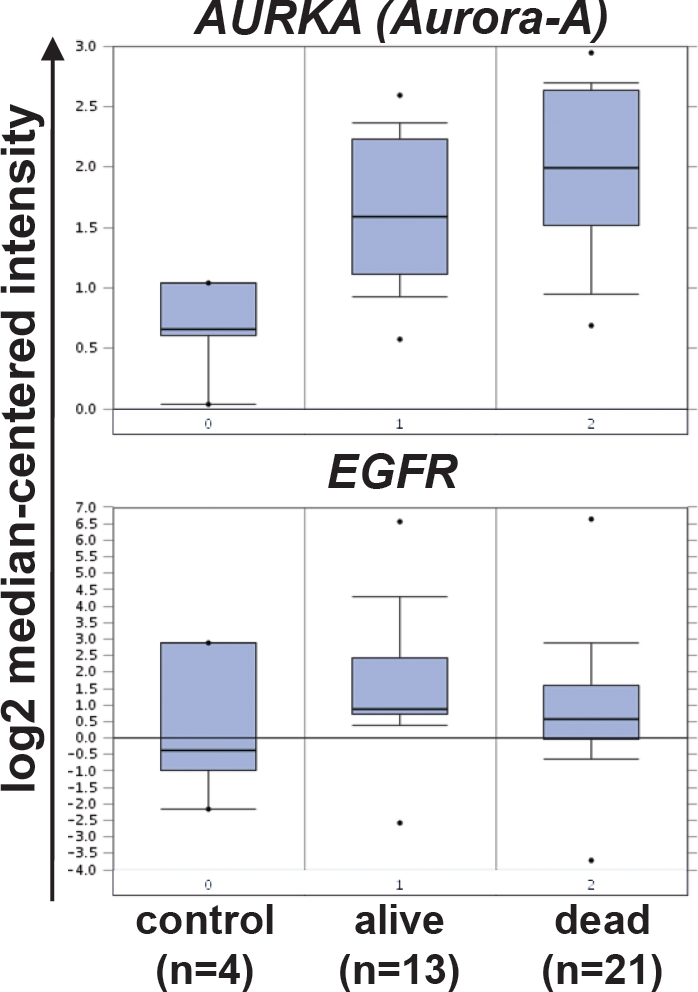
A public database (www.oncomine.com) was searched for gene expression analyses studies that compare AURORA-A transcript levels in control tissue and SCCHN samples from patients who were alive or dead [22]. Shown is the log2 median-centered relative intensity of expression for AURORA-A (AURKA, upper panel, tumor versus control tissue: p = 0.002, [reporter: 34851_at]) and EGFR (lower panel, tumor versus control tissue: n.s., [reporter: 1537_at]).