


Figure 7.
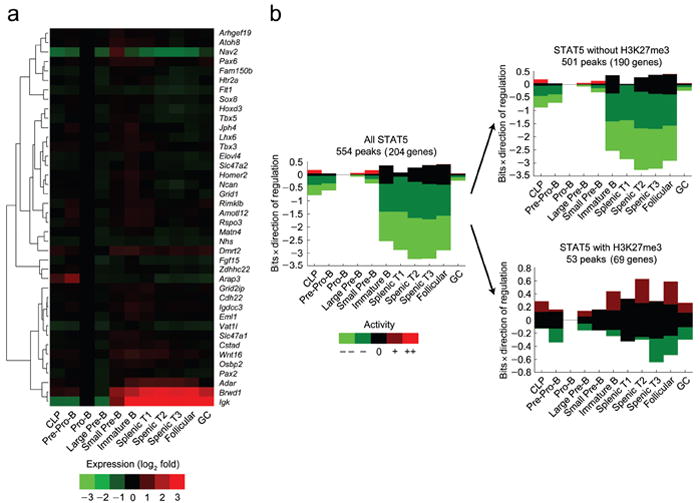
H3K27 trimethylation correlates with STAT5 target genes that are repressed throughout B cell development. (a) Heat map of genes targeted by both STAT5 and H3K27me3 indentified in Fig. 6 representing fold changes in expression (log2) as a function of B cell development and maturation relative to the pro-B cell stage (ImmGen Consortium). (b) EMBER analysis combining STAT5 and H3K27me3 ChIP-seq results with total mouse genome expression microarrays from the ImmGen Consortium. Predominant expression patterns of genes within 100 kb of STAT5 binding with or without coincidental H3K27me3 marks were assessed. Coincidence required a minimum of 2 bp overlap. In some instances more than one gene is within 100 kb of a peak. For example, 69 genes are within 100 kb of the 53 STAT5 and H3K27me3 coincident peaks. All indicated B cell developmental stages are compared to expression at pro-B cell stage. Change in mean expression behavior is categorized as: ≤−3s.d. (--); between −1 and −3s.d. (-); between −1 and 1s.d. (0); between 1 and 3s.d. (+); greater than 3s.d., with s.d. defined as the sum of the two standard deviations calculated for the experimental replicates at the two conditions.