


Figure 5.
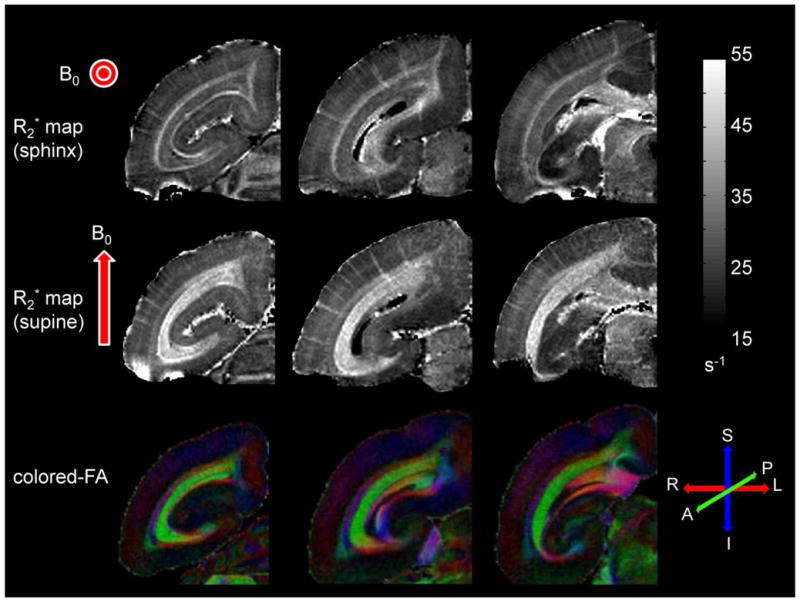
The top row shows R2* maps from three coronal slices acquired in the sphinx position in vivo. The middle row shows R2* maps of the same slices acquired in the supine position, also in vivo. The bottom row shows the corresponding color-encoded fractional anisotropy maps acquired ex vivo from a different brain. Red arrows represent the orientation of the main field for each acquisition. Grayscale bar for R2* relaxation rate is given in s−1. Red, green, and blue colors correspond to right-left, anterior-posterior, and superior-inferior orientations, respectively. Note that the contrast reverses in the white matter regions as the brain position is changed. Note also the excellent correspondence of the optic radiations on R2* maps acquired in the supine position and on the fractional anisotropy maps acquired ex vivo.