


Figure 2.
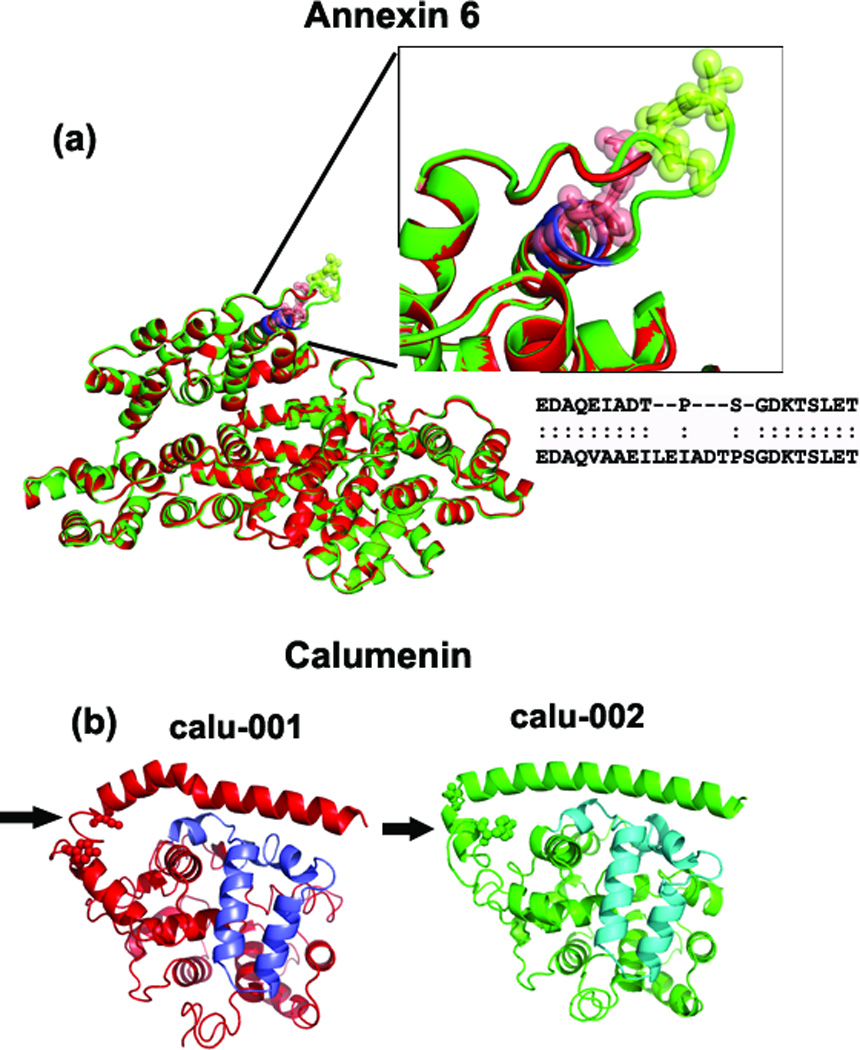
Superimposed predicted structures of anxa6 and calu. (a) Superimposed anxa6 models show perfect alignment except for one region (shown in the inset figure). Due to the absence of ‘VAAEIL’ residues (aa 525–530 in anxa6-001) in the anxa6-002 variant (shown in red), the loop region is smaller. The structural alignment shows that the ’TPS’ residues are not aligned between the anxa6 variants (see inset box), which could affect the post-translational modification of Thr & Ser residues (as shown in green and red spheres in the inset figure). (b) Calu-001 and calu-002 models with the region of structural variation indicated by arrow. This region in calu-001 (red) is in the loop instead of coil-helix-coil region found in calu-002; two potential phosphorylation sites (Ser-35, Tyr-47) are found here (shown in spheres). The purple and blue-colored regions show the alternatively-spliced regions in Calumenin variants.