


Figure 1.
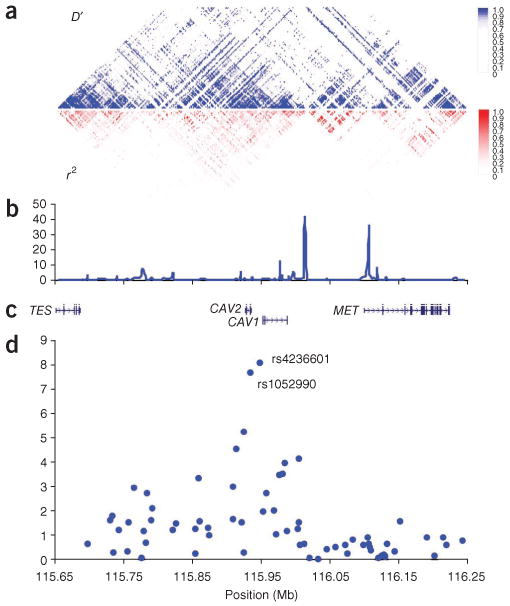
The 7q31 locus. (a) The pairwise correlation structure in a 600-kb interval (115.65–116.25 Mb, NCBI B36) on chromosome 7. The upper plot shows pairwise D′ for 533 common SNPs (defined as those having minor allele frequency >5%) from the Utah CEU HapMap (r22) samples. The lower plot shows the corresponding r2 values. (b) Estimated sex-averaged recombination rates (saRR) in cM/Mb from the HapMap Phase II data31. (c) Location of known genes in the region. (d) Schematic view of the association with POAG for all 70 markers tested in the GWAS in the region. All panels use the same horizontal scale shown in d.