


Figure 3.
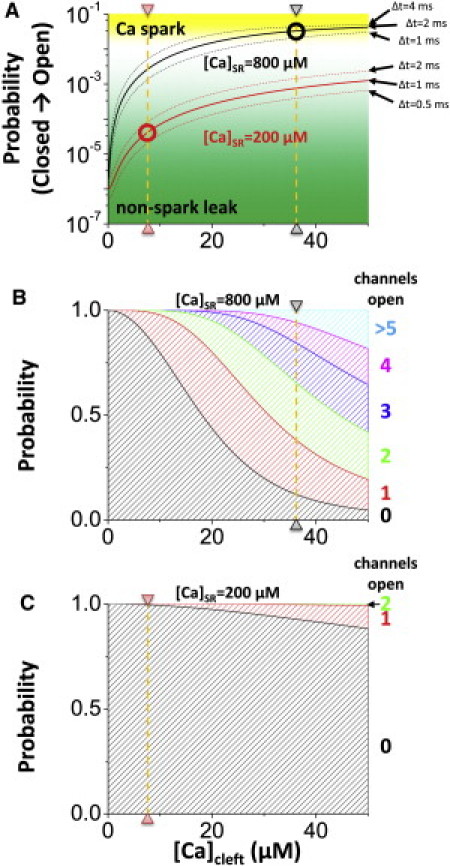
(A) Probability of transition from the closed to the open state when RyR channel is exposed to [Ca]Cleft for the indicated Δt ms. Circles indicate [Ca]Cleft level if RyR opens for mean open time for each case (black, low SR Ca load;, red, high SR Ca load). (B) Probability that n RyR channels will open when the CaRU is exposed to [Ca]Cleft for 2 ms with a high SR Ca load (800 μM). The orange line indicates the [Ca]Cleft level if RyR opens for the mean open time. (C) Probability that n RyR channels open when the CaRU is exposed to [Ca]Cleft for 1 ms with low SR Ca load (200 μM). The orange line indicates [Ca]Cleft level if RyR opens for the mean open time.