


Figure 5.
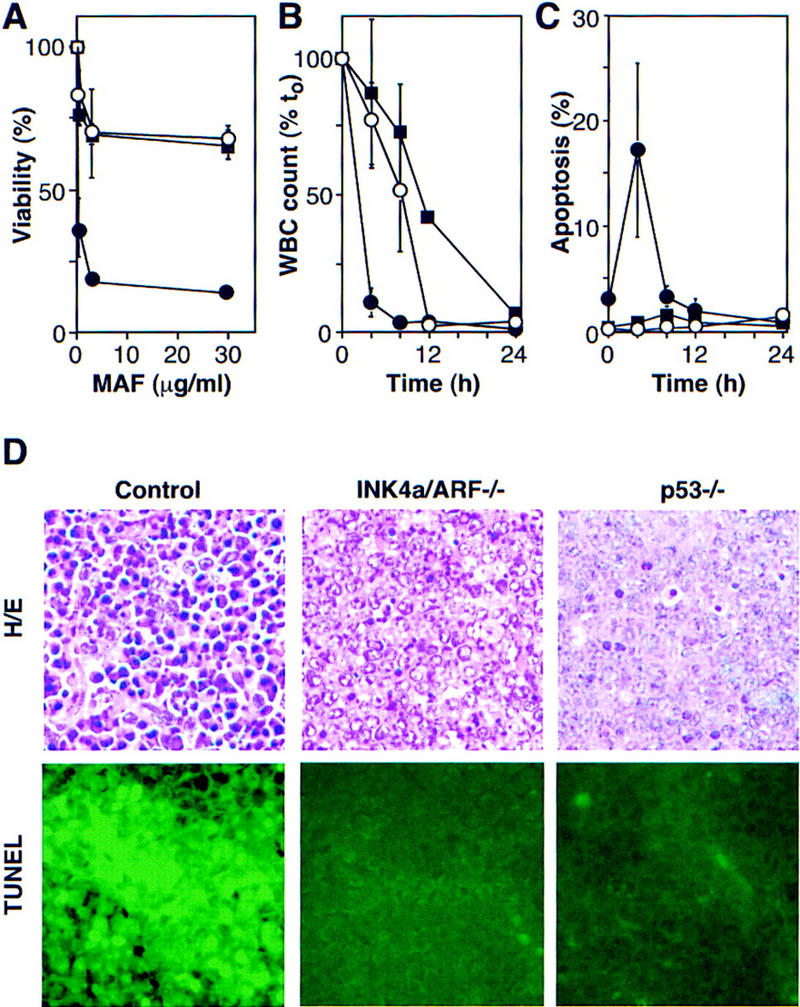
INK4a/ARF, p53, and short-term response to chemotherapy. (A) Explanted control (●), INK4a/ARF−/− (○), and p53−/− (█) lymphoma cells were treated with mafosphamide (MAF). Viability was analyzed after 24 hr by trypan blue exclusion; each value was normalized to untreated controls and represents the mean ± s.d. of two independently derived tumors reproduced in duplicate. (B) Leukemic mice were treated with CTX, and blood samples were taken at the indicated times. Each WBC is relative to its pretreatment value and represents the mean ± s.d. of three independent leukemias. Symbols are as in A. (C) Same as in B, except that blood samples were ethanol-fixed and stained with the DNA fluorochrome DAPI to visualize the chromatin condensation characteristic of apoptotic cells. Each value reflects the percentage of cells with apoptotic morphology (of 200 cells counted) and represents the mean ± s.d. of three independent leukemias. Symbols are as in A. (D) HE staining and TUNEL of lymph nodes harboring control, INK4a/ARF−/−, and p53−/− lymphomas 5 hr after CTX treatment.