


Figure 5.
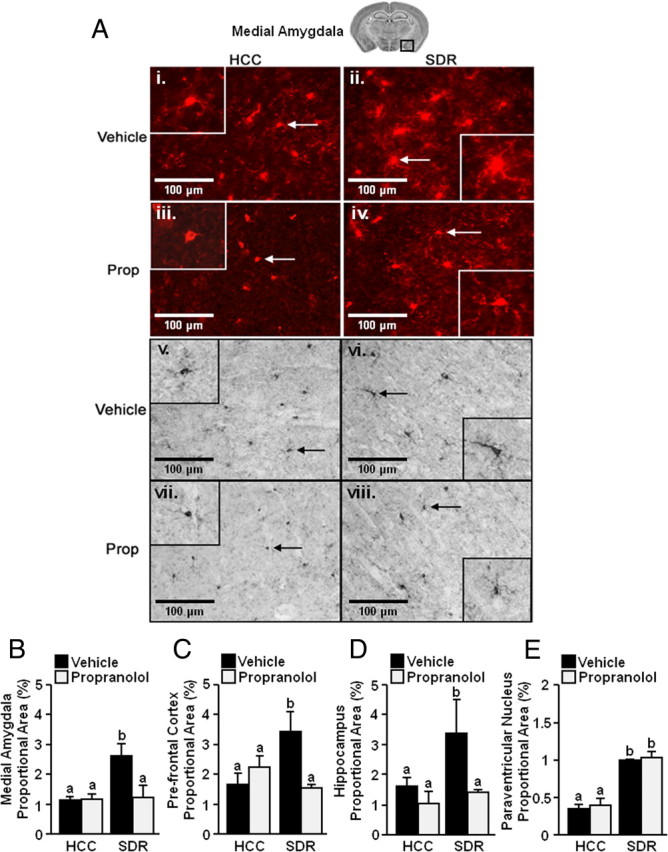
Increased activated morphology of microglia after repeated social defeat. Male C57BL/6 mice were injected subcutaneously with vehicle or propranolol (Prop; 10 mg/kg) before each of the six cycles of SDR. Mice were perfused and brains were collected 14 h after the sixth cycle of social defeat for Iba-1 staining. A, Representative pictures of Iba-1 staining [fluorescent (i–iv) and DAB (v–viii) from the medial amygdala (40×) are shown). Inset includes enlarged image of Iba-1+ cell indicated by arrow. B–E, Proportional area for Iba-1 staining in the medial amygdala (B, n = 3), prefrontal cortex (C, n = 3), hippocampus (D, n = 3), and paraventricular nucleus (E, n = 3). Bars represent the mean ± SEM. Means with different letters (a or b) are significantly different (p < 0.05) from each other.