


Figure 2.
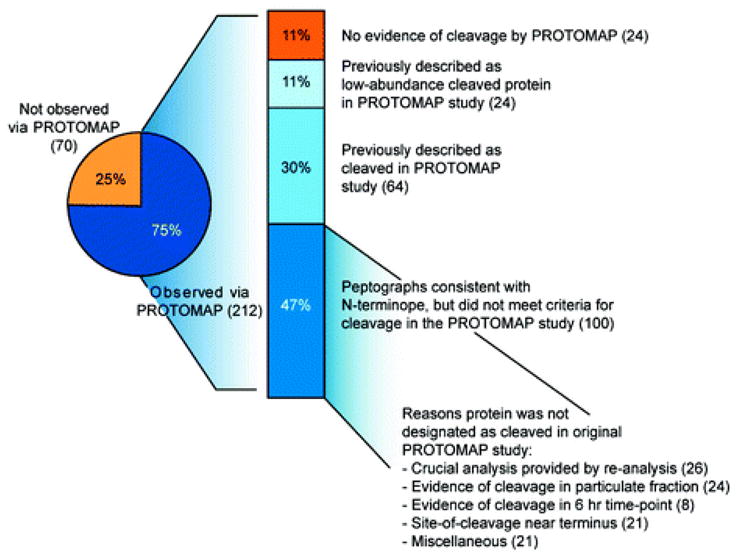
Analysis of the overlap between the Subtiligase and PROTOMAP data sets. The pie chart shows that 75% of the proteins detected as cleaved with the Subtiligase approach generated interpretable peptographs in the PROTOMAP study. Of these 212 proteins, 88% showed patterns that were consistent with the cleavage event predicted by the N-terminope (see Supplementary Table 1 for a direct comparison). Eighty-eight proteins were included in one of the two supplemental tables from the original PROTOMAP study describing cleaved proteins, whereas an additional 100 proteins were not designated as “cleaved” in this study for a variety of reasons: many proteins only displayed evidence of cleavage in the particulate fraction or a later time point (24 and 8, respectively). Additionally, re-analysis of the data with advanced statistical techniques identified peptographs that provide clear evidence of cleavage for many (26) low-abundance proteins and persistent fragments. See Supplementary Table 1 for the complete integration of the Subtiligase and PROTOMAP data sets.