


Figure 6. mDCs and T cells secrete IL-2 after Ag-specific interactions.
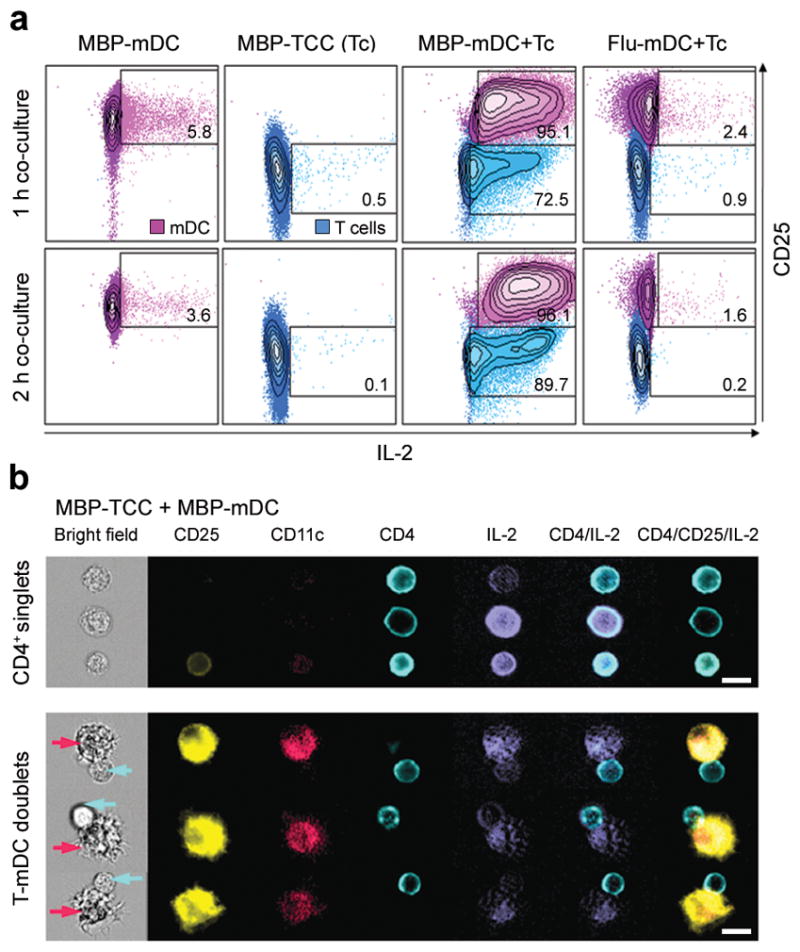
(a) Flow cytometric analysis of IL-2 secretion of mDCs loaded with 1μM MBP(83–99) peptide (MBP-mDC; first column), MBP-specific T cells (MBP-TCC (Tc); second column), co-cultures of MBP-mDCs with MBP-specific T cells (MBP-mDC+Tc; third column) and co-cultures of mDCs loaded with 1μM Flu-HA(306–318) peptide with MBP-specific T cells (Flu-mDC+Tc; fourth column). IL-2 was detected after 1 h (upper panels) and 2 h (lower panels) of co-culture and is plotted against CD25 expression of mDCs and T cells. Percentages of IL-2 secretion by mDCs and T cells are shown in quadrants. For comparison, mDCs and T cells are presented in the same blot, but were gated separately on CD11c and CD4 expression. (b) Independent experiment visualizing secreted IL-2 and surface expression of CD25, CD11c, and CD4 by Amnis ImageStream after 2 h co-culture of MBP-mDCs with MBP-specific T cells. The upper panel of this figure shows single MBP-specific CD4+ T cells in the bright field of the microscope with simultaneous expression/secretion of fluorescently labeled CD25, CD4 and IL-2. The lower panel demonstrates conjugates of MBP-loaded mDCs with MBP-specific T cells (mDCs highlighted by purple arrows, CD4+ T cells by blue arrows). Scale bars, 10 μm.