


Figure 6.
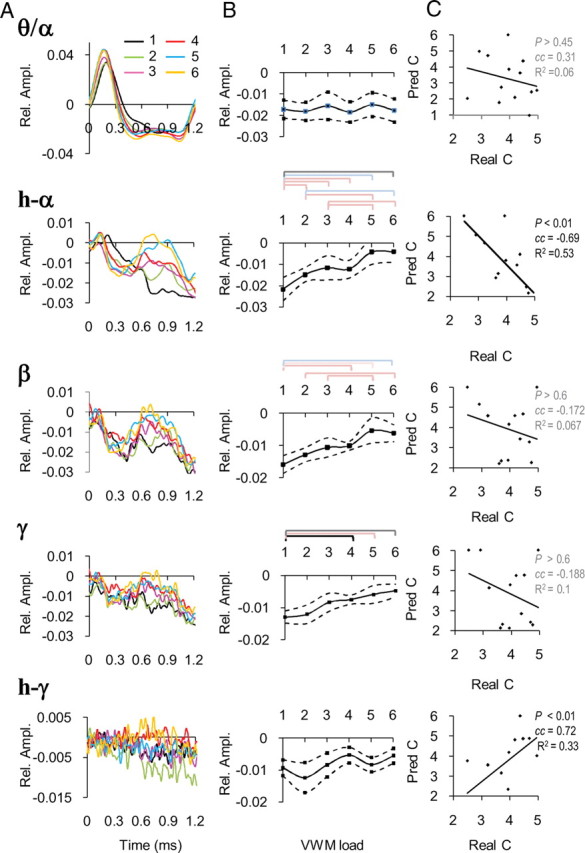
Waveform visualizations and post hoc statistics for the memory load-dependent retention period oscillations. A, Broad-band oscillation amplitudes averaged across those cortical regions that were significantly correlated with memory load (Fig. 5). B, The oscillation amplitudes were averaged across the late retention period and within each subject (700–1000 ms, black line, dashed lines indicate the SEM across subjects). The brackets indicate the memory load pairs that were significantly different in post hoc paired t tests (black lines: p < 0.01, corrected with Ntests = 15; gray lines: p < 0.05, corrected; blue lines: p < 0.01, uncorrected; and pink lines: p < 0.05, uncorrected). These data corroborate the findings that h-α-, β-, and γ-band oscillation amplitudes are positively correlated with memory load even though they remain suppressed below the baseline level. C, The correlation between the individual behavioral memory capacity values (Real C) with the capacity values predicted by the dependence of the oscillation amplitudes on memory load (Pred. C). Rel. Ampl., Relative amplitude. Other abbreviations are as in Figure 4.