


Figure 3.
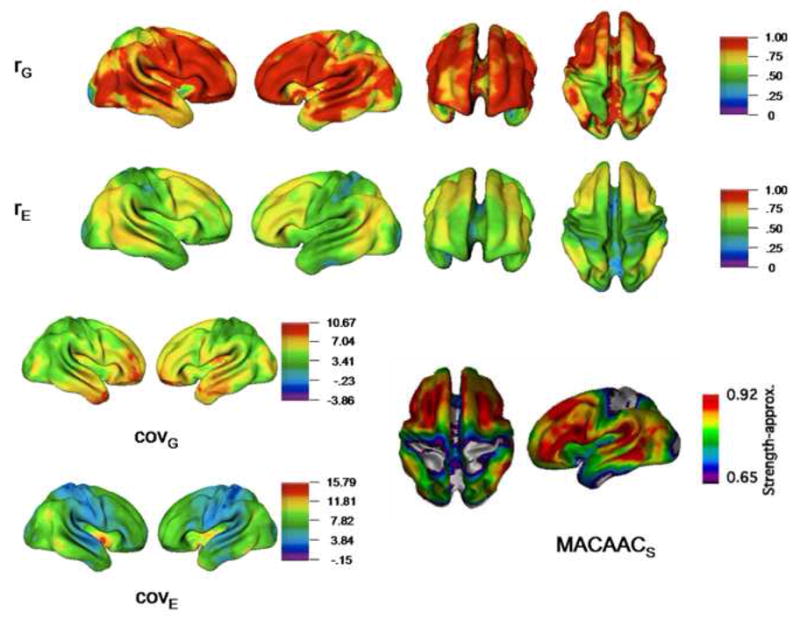
Maps of genetic and environmental relationships between global mean CT and individual vertices. Genetic and environmental correlations (rG and rE) and covariances (covG and covE) are shown. Both genetic and environmental correlations were highly significant throughout the brain. Map of MACAACs statistic (lower right) is adapted from Lerch et al. (2006).