


Figure 5. Importin α2 Regulates X. Laevis Developmental Nuclear Scaling.
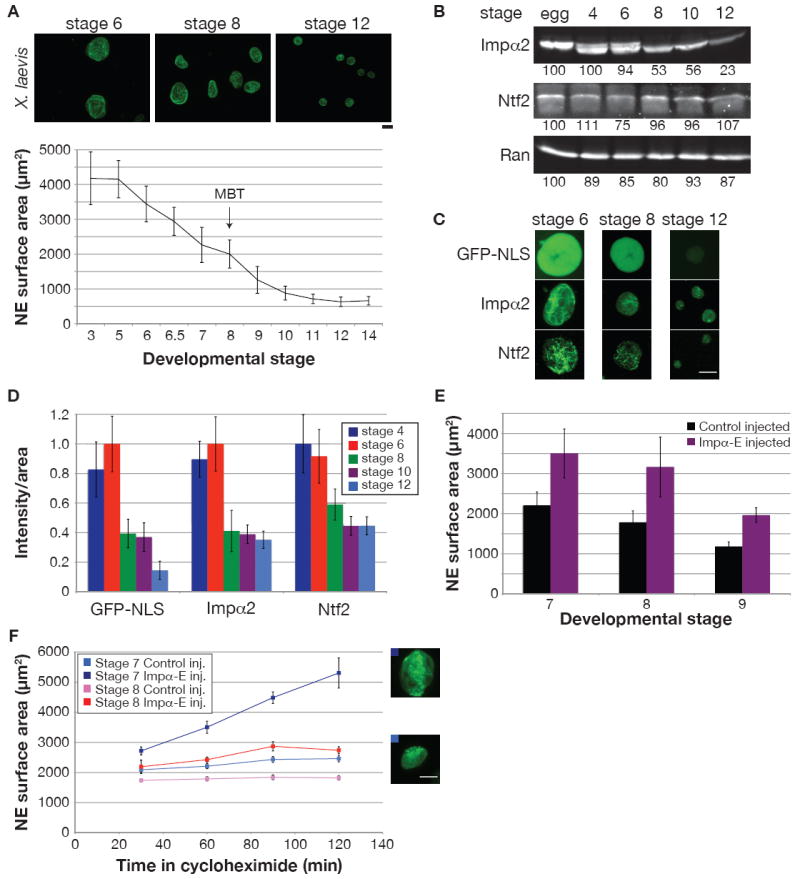
(A) Different stage X. laevis embryos were arrested with cycloheximide for 60 min. Nuclei were isolated from embryo extracts and visualized by immunofluorescence using mAb414. Scale bar, 20 μm. For the graph, NE surface area was quantified for at least 50 nuclei from each stage. Error bars represent SD.
(B) 25 μg of protein from different stage embryo extracts were analyzed by Western blot as in Figure 2A.
(C) To assess nuclear import, GFP-NLS (1 μM) was added to embryo extracts and images of unfixed nuclei were acquired 30 min later with the same exposure time. Immunofluorescence was performed on fixed embryonic nuclei, and images were acquired with the same exposure time. Scale bar, 20 μm.
(D) Quantification of (C). Nuclear fluorescence intensity per unit area was calculated for at least 50 nuclei per stage, averaged, and normalized to 1.0 (arbitrary units). Error bars represent SD.
(E) Single-cell fertilized X. laevis embryos were injected with 1 ng importin α-E mRNA or water as control. Nuclei were isolated and quantified as in (A), except that an antibody against Xenopus LB3 was used for immunofluorescence. One representative experiment of two is shown for each stage, and error bars represent SD.
(F) Experiments similar to (E) were performed except that embryos were arrested for different lengths of time in cycloheximide. Error bars represent SE. Representative stage 7 nuclei at 120 min are shown for control (bottom) and importin α-E (top) injected embryos. Scale bar, 20 μm.
See also Figure S5.