


Figure 2. Spatiotemporal dynamics of MTs in the wild-type wing.
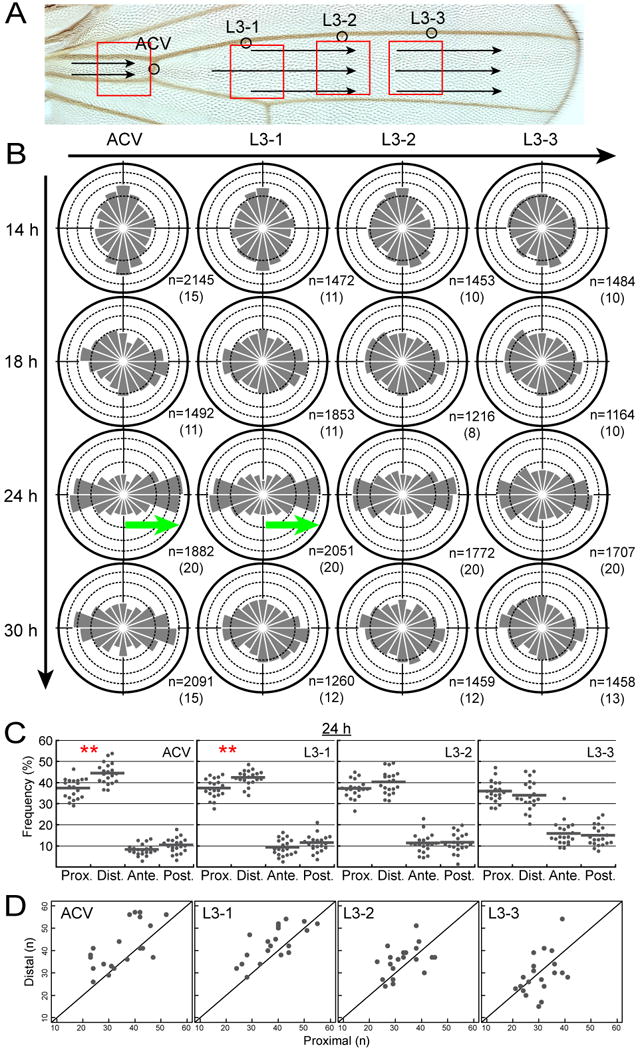
(A) Indicated by red boxes are 4 distinct locations in the wild-type wing where MT growth was observed. The image of the adult wing was used for clarity (see images of pupal wings in Figure S1A). 4 campaniform sensilla were used as spatial landmarks (circles). Arrows represent the polarity of wing hairs on the dorsal surface.
(B) The directional distribution of MT growth. The horizontal axis on the top represents the P-D position; and the vertical on the left, the pupal age. Green arrows indicate statistically significant asymmetry of MT polarity with an excess of + end-distal MTs at 24 h APF. Indicated at the lower right-hand corner of each diagram is the number of EB1-GFP comets tracked and that of the wing from which the data were collected (in parentheses).
(C) Statistical analysis of the directional preference of the EB1-GFP comets at 24 h APF. + end-distal MTs were more abundant than + end-proximal ones at the ACV and L3-1 locations [**: p < 0.01; Wilcoxon signed-rank test; actual p-values were 0.003724 (ACV) and 0.004227 (L3-1)].
(D) The number of proximally shooting comets and that of distally shooting ones in each sample at each location at 24 h APF were plotted on X and Y axes, respectively, together with a 45 degree line.