


Figure 3. Slower translation of γ-actin is linked to arginylation-mediated degradation.
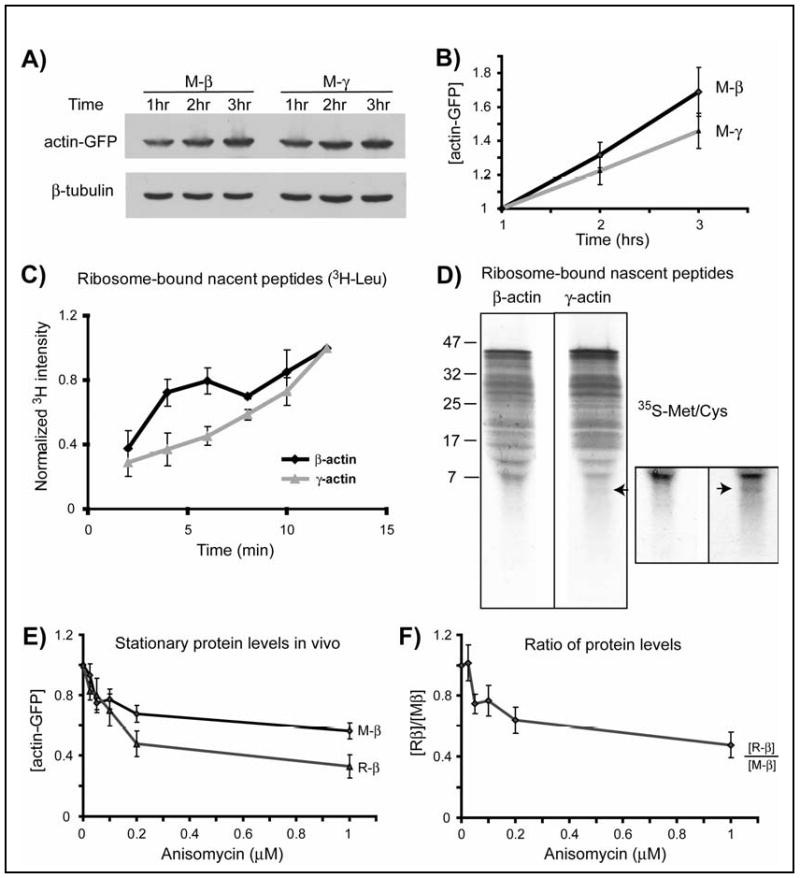
A. Representative immunoblots of the lysates of HEK 293T cells transfected with actin-GFP constructs and treated with MG132, probed with anti-GFP and β-tubulin as a loading control. B. Quantification of protein levels for M-β and M-γ-actin adjusted to the starting mRNA level and normalized to the 1 hr time point in each set (n=8). C. Incorporation of 3H-Leu into ribosome-bound nascent peptides of β- and γ-actin over time, normalized to 12′ time point (n=3). D. Pattern of 35S-labeled nascent peptides. Boxed area represents the bottom part of the same gel, contrasted to emphasize the lower molecular weight bands using Adobe Photoshop ‘brightness/contrast’ function applied equally to the entire inset image. Arrow in both images indicates the additional low molecular weight band present in γ-actin. Similar results were observed in two independent repeats. E. Stationary protein levels of actin proteins plotted against the increasing concentrations of anisomycin. F. Stationary levels of actin proteins from the experiment shown in E, quantified by independently performed Western blots by loading M-β and R-β side by side and plotted as ratio of [R-β]/[M-β] against anisomycin concentration. Curves in E and F are normalized to the sample with 0 μM of anisomycin in each set (n=3). Numbers in all panels represent mean +/- SEM.