


Figure 2.
TBC1D24 Is a Potent Modulator of Neuronal Cell Morphology and Primary Axon Specification
For all experiments: ED18.5 hippocampal neurons were isolated via established methods20 and then transfected with the Amaxa Mouse Neuron Nucleofector kit (Lonza). Cells were transfected with 1 μg of the supplied pmaxGFP vector alone (control) or in addition to 2 μg of either a commercially available expression vector RC210346 (NM_020705; OriGene Technologies) for the human TBC1D24 ORF (TBC1D24WT) or the same RC210346 vector with the c.751T>C mutation introduced by site-directed mutagenesis (TBC1D24F251L). Following transfection, neurons were plated onto poly-D-lysine (Sigma)-coated coverslips at a density of 1.25 × 10⁵ cells per well in Neurobasal media containing 2% (vol/vol) B27 (Invitrogen) and 10% fetal calf serum (FCS, Thermoscientific). Once cells were attached (∼4 hr), the FCS was removed and the cells were cultured for a further 3, 5, or 7 days, with half of the media changed every 4 days. Cells were fixed with 4% paraformaldehyde for 15 min at room temperature and then permeabilized, and nonspecific antigens were blocked with a solution of phosphate-buffered saline containing 1% Tween 20 (PBST) and 10% normal horse serum (Sigma). Primary antibodies were incubated overnight at 4°C at the following dilutions: chicken anti-MAP2 (1:2000, Chemicon, Millipore Bioscience Research Products) to identify dendrites or mouse anti-Tau1 (1:2000, Chemicon) to identify axons. Either donkey anti-mouse-Alexa647 (Invitrogen) or donkey anti-chicken-Cy3 (Chemicon) secondary antibodies were used at a dilution of 1:800. Nuclei were stained with DAPI as per the manufacturer's protocol (Invitrogen). Coverslips were mounted with Slowfade antifade mounting media (Invitrogen). ∗p < 0.05, ∗∗p < 0.01, ∗∗∗p < 0.005 by Student's two-tailed t test, assuming equal variances.
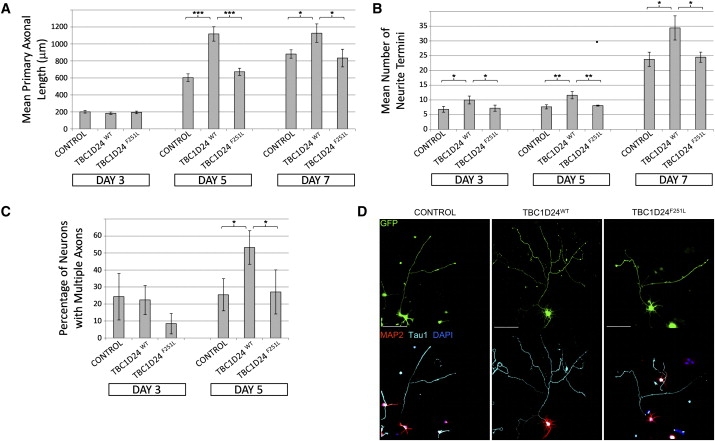
(A) Overexpression of TBC1D24WT but not TBC1D24F251L promotes axonal growth in cultured hippocampal neurons. Graph depicts average length of primary axons ± standard deviation (SD) from triplicate experiments measured with the “measure cumulative distances” plugin for the ImageJ software package (National Institutes of Health), with at least 20 measurements made for each treatment.
(B) Overexpression of TBC1D24WT but not TBC1D24F251L promotes arborization of cultured hippocampal neurons. Graph depicts the average number of neurite termini per cell ± SD from triplicate experiments, with at least 10 neurons counted for each treatment.
(C) Overexpression of TBC1D24WT but not TBC1D24F251L promotes ectopic axonal specification in hippocampal neurons after 5 days' culture. Graph shows average percentage of transfected cells with multiple axons ± SD from triplicate experiments, with at least 10 neurons counted for each treatment.
(D) Example images of transfected neurons at 5 days of differentiation, showing either native GFP fluorescence or indirect immunofluorescent staining with Tau1, MAP2, and DAPI, as described. Scale bars represent 100 μM.