


Fig. 2.
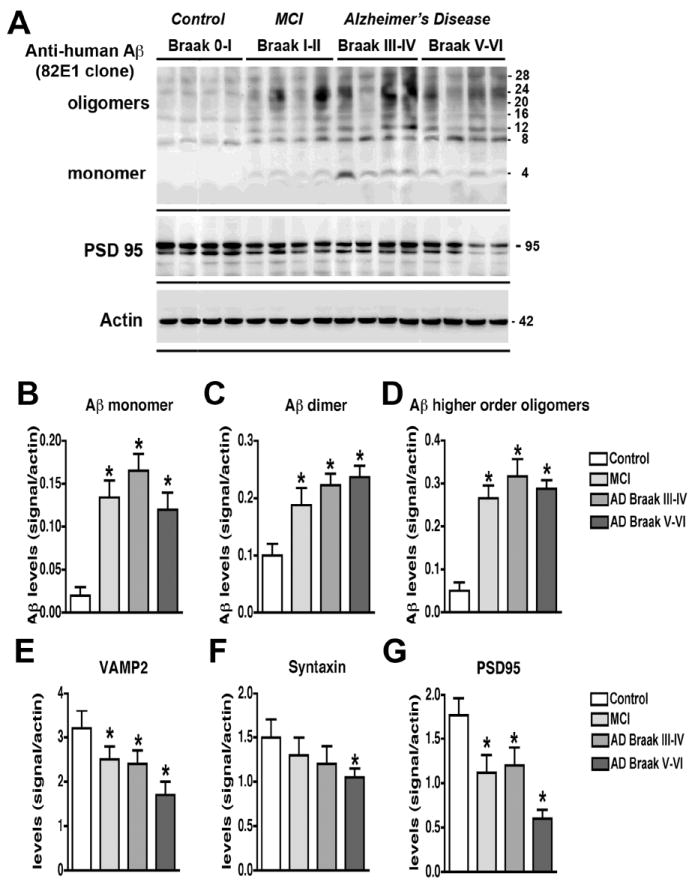
Analysis of the Aβ and synaptic protein bands detected by immunoblot in control and AD brain samples. Samples were homogenized using Buffer A and probed with antibodies against Aβ (82E1) and synaptic proteins (VAMP2, syntaxin, PSD95). A. Representative western blot with the membrane fractions from controls, MCI and AD cases displaying bands corresponding to Aβ monomer (4 kDa) and multimers (8-28 kDa) and PSD95 (95 kDa). B-D. Semi-quantitative analysis of the bands representing Aβ monomer (4 kDa) (B), dimer (8 kDa) (C) and higher order oligomers (12-28 kDa) (D) showing a progressive increase in AD cases. E-G. Semi-quantitative analysis of immunoblots for VAMP2 (E), syntaxin (F), and PSD95 (G) showing a reduction in immunoreactivity in AD cases. N=5 cases per group, *P<0.05 compared to non-demented control by one-way ANOVA with post-hoc Dunnett’s test.