


Figure 3.
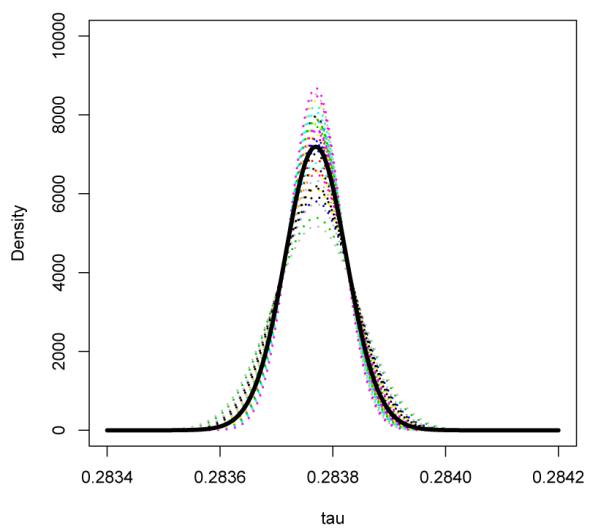
Beta-Gamma Model: Estimated density functions for the log relative risk conditional on Wβi for all observed values of Wi across 48 studies assuming that pi ~ Beta(ψγ, ψWβi). The thick black curve represents the marginal distribution of τ by averaging the distribution of τi | Wβi across studies.