


Figure 10.
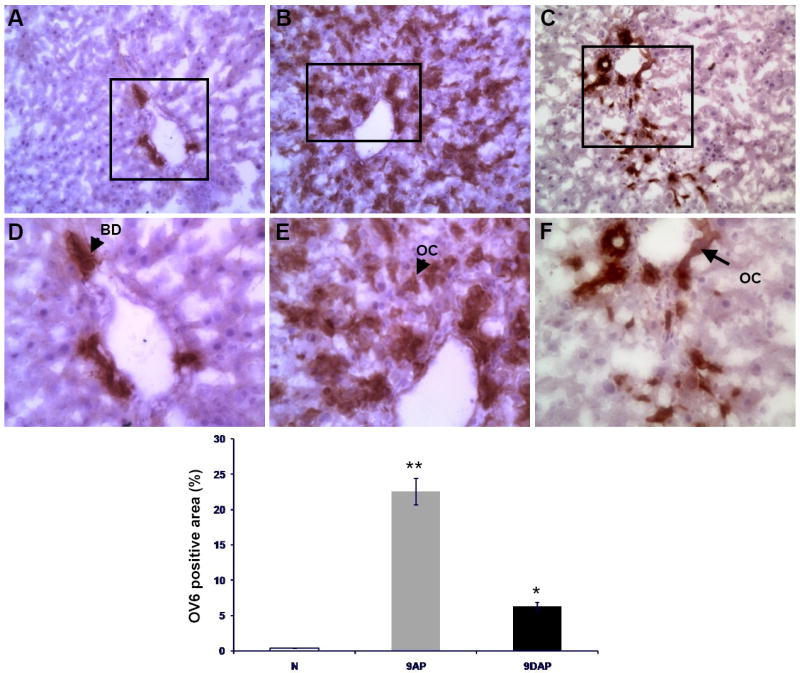
Oval cell response reduction assessed by quantitative image analysis (D) of OV6 positive areas on tissue sections obtained from normal liver (A, N) and animals sacrificed 9 days after the acute liver injury: (B, 9AP) subjected to the 2-AAF/PHx protocol, and (C, 9DAP) fed L-cysteine during the oval cell activation treatment. OC – oval cell, BD – bile duct. Upper panels are shown at x20, lower panels at x40 magnification.