


Figure 2.
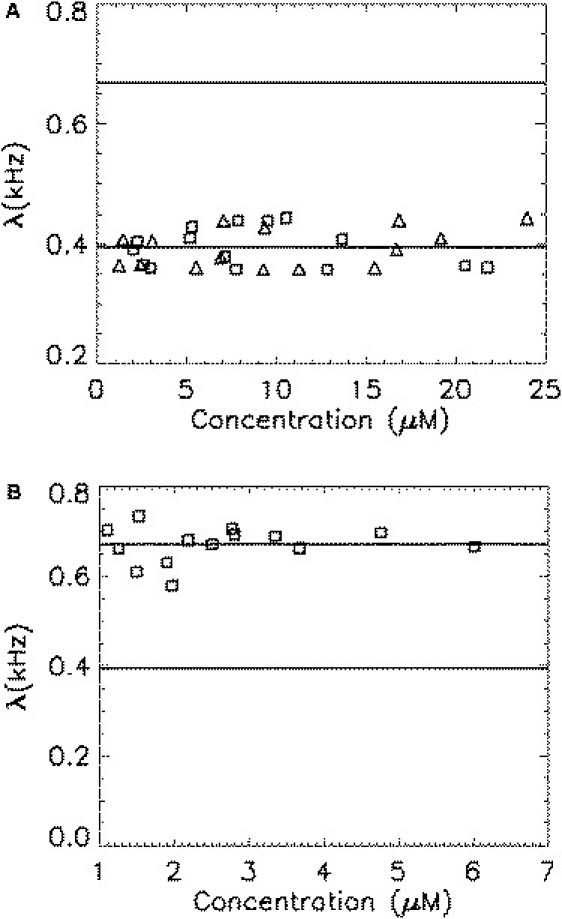
Brightness of monomeric and homodimeric mCherry is plotted as a function of protein concentration. Each symbol represents a measurement for a different cell. The concentration has been corrected for the bias due to the two states of mCherry (Eq. 5). (A) The brightness of mCherry (triangles) is concentration-independent, as expected for a monomeric protein. The brightness of mCherry-RARLBD (squares) equals that of mCherry, indicating that labeling does not change the brightness of mCherry. (B) The brightness of the homodimer Ch-RARLBD-Ch (squares) is concentration-independent, but less than twice the brightness of monomeric mCherry.