


Figure 8. All-vs.-all core Cα RMSD matrix of 2 transient N→N′→N transitions from 323K/3.
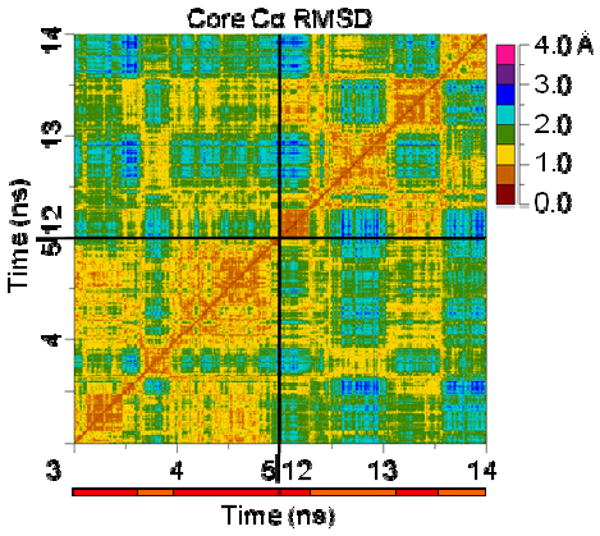
Much like for the N′→D→N′ transition in the 323K/2 43 ns TS, an “X” is visible on the core Cα RMSD matrix for both N→N′→N transitions. In this case, there is a third “X” that is apparent off the diagonal at the intersection of the times at which the other two “X”s occur. This suggests that not only are the N↔N′ paths very similar, but also the N→N′→N path from the first transition is remarkably similar to that from the second.