


Figure 5. Matrix of core Cα RMSDs between average structures representative of N, N′, and TS.
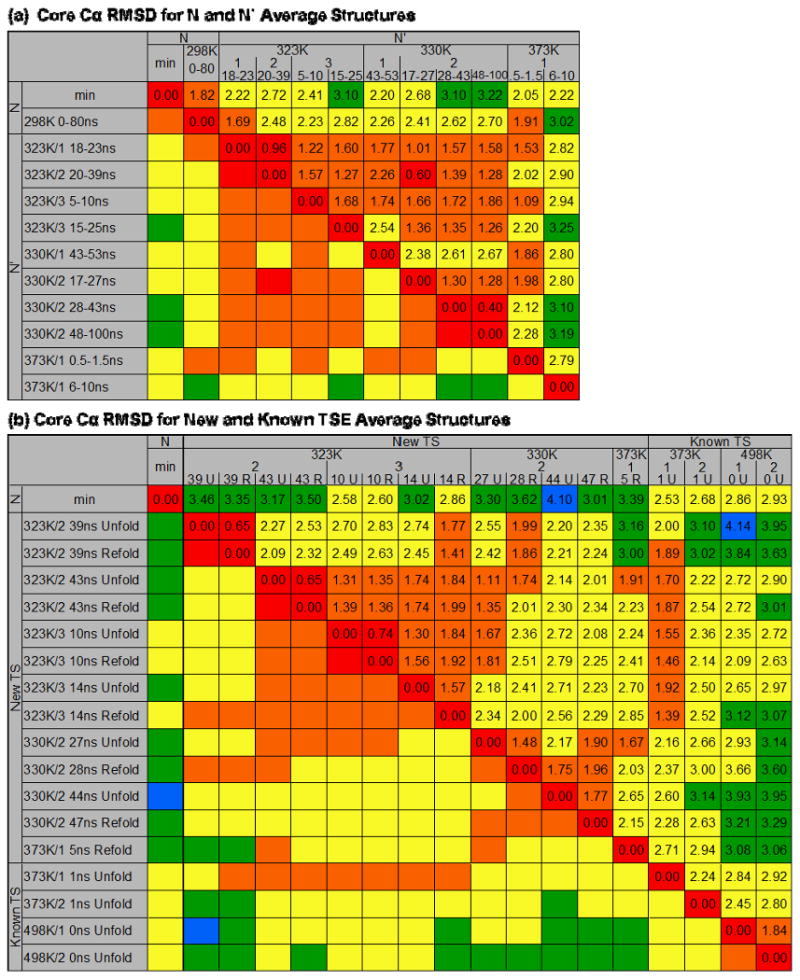
The RMSDs reported are for the core Cα residues of the average structure over the time periods indicated and are colored to visualize trends 0-1 Å (red), 1-2 Å (orange), 2-3 Å (yellow), 3-4 Å (green), 4-5 Å (blue). (a) Core Cα RMSDs for average N′ structures. The simulation temperature, number, and time span in ns of N′ is given. Excluding the later 373K/1 N′ structure, all of the N′ structures are within 3 Å core Cα RMSD of each other, and with the exception of 330K/1, all of the low-temperature N′ structures are within 2 Å. (b) Core Cα RMSD for the 13 new average TSE structures and 4 previously identified. The simulation temperature, number, and ns during which the unfolding (U) or refolding (R) TSE occurred is given. The average TSE structures are most similar to other TSE structures at the same temperatures, and all are about the same core Cα RMSD from N (∼2.5-3.5 Å).