


Figure 4. HIII-core residue pairs fraction of time in contact for N, N′, and new TSEs in each simulation.
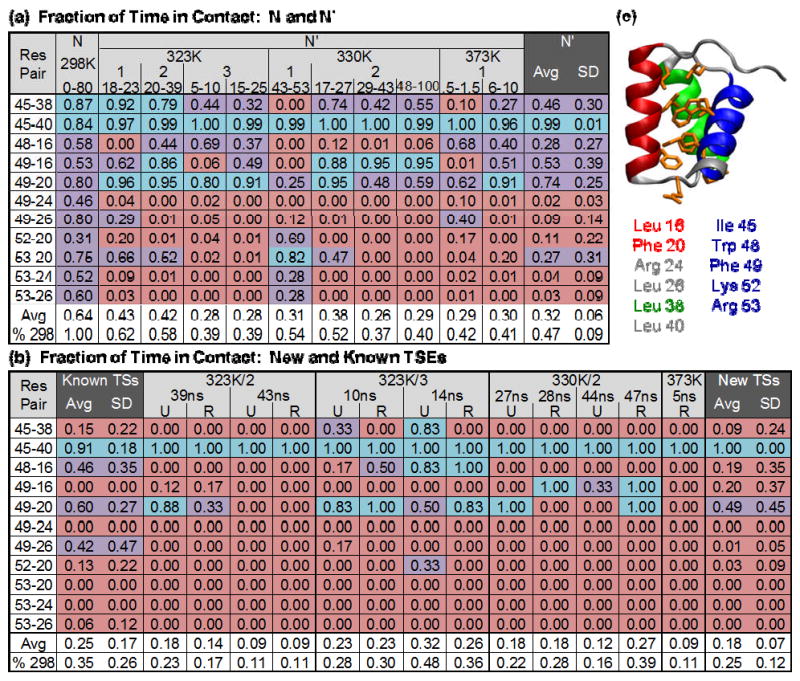
(a)-(b) are colored: < 25% pink, 25-75% purple, >75% blue. (a) Contacts for N in the 298K simulation and N′ in the 323, 330, and 373K simulations. The temperature of the simulation, simulation number, and time span in ns of the N′ state is given. (b) Contacts for new and previously identified TSEs. The simulation temperature and number is given (373K is 373K/1) as well as the ns during which the unfolding (U) or refolding (R) TSE occurred. The average fraction of time in contact was reported for each simulation as was the fraction of time in contact relative to the native (298K) simulation. Additionally, the average and standard deviation of the fraction of time in contact was calculated for each contact pair across all compared time spans. The average fraction of contacts is quite different for each of the states, N, N′, and TS, with a low standard deviation, and those contacts that are lost are lost fairly consistently. (c) Each of the selected contact residues is shown on the En-HD structure in orange.