


Figure 2.
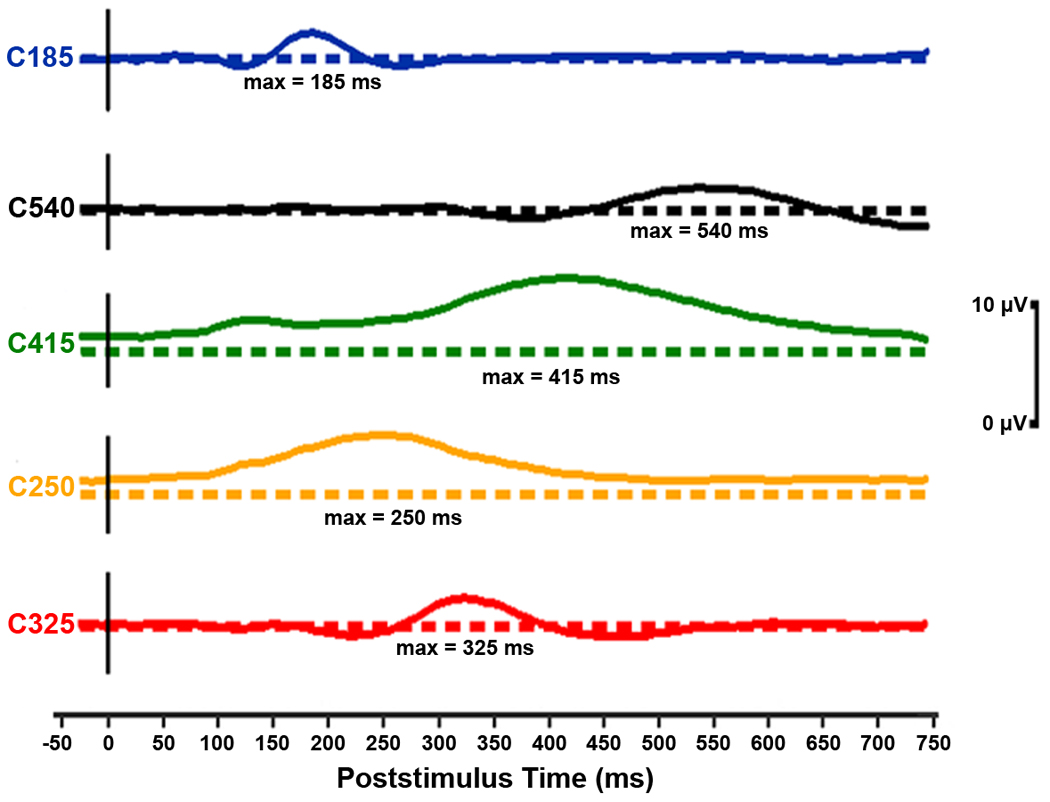
Temporal waveforms of the ERP components selected by the stepwise discriminant procedure for their predictive power of progression to AD in MCI. Each component is offset here with its baseline shown as a dashed line. In these component waveforms, the metric has been restored by multiplying the loading at each time point by the standard deviation of the data set at the corresponding time point (Chapman and McCrary, 1995). The amplitudes depicted are for a component score of 1.0. The five components appear (top to bottom) in the order they were selected by the discriminant procedure. The discriminant procedure actually selected component_conditions (these were ERP components scores under either relevant or irrelevant stimulus conditions; for more information, see Table 3 and Table 4).